Guide · General
Global Inflation Rates: Historical Peaks and 2026 Outlook
Global inflation rates by year, country group and measure, with 1970s peaks, the 2022 spike and 2026 to 2027 forecasts from the IMF, OECD and World Bank.
By the Statlyst data desk · Updated November 7, 2026 · 11 min read
The IMF reports that global inflation reached 9.5% in September 2022, measured as the 12-month change in consumer prices across economies. That figure is a defined measure for a particular period, not a universal description of what households paid: the result changes with the time frame, price measure and economies included.
Table of Contents
- Global Inflation Rates at a Glance
- What a Global Inflation Rate Actually Measures
- How Inflation Is Measured and Which Measure to Use
- Why One Global Number Hides Regional Gaps
- How Global Inflation Rates Changed Over Time
- Where Global Inflation Is Heading in 2026 and 2027
- Check Scope and Source Before You Publish a Rate
Global Inflation Rates at a Glance
The IMF's October 2026 World Economic Outlook projects global headline inflation at 4.7% in 2026, following an estimated 4.1% in 2025, then easing to 4.1% in 2027. These are forecasts based on statistical information available through October 1, 2026, not completed observations.
The reference points below draw on different dates, measures and aggregation methods. They are not one continuous series.
| Period | Measure and scope | Value | Primary source |
|---|---|---|---|
| 1974 | Global inflation, annual average, historical peak, main World Bank series | 16.6% | World Bank historical inflation analysis |
| 1974 | Global inflation, annual average, related World Bank historical series | 16.9% | World Bank historical inflation analysis |
| 2015 | Global inflation, related World Bank historical series | 1.9% | World Bank historical inflation analysis |
| 2017 | Global inflation, main World Bank series | 2.6% | World Bank historical inflation analysis |
| 2020 | Global inflation, related World Bank historical series | 2.5% | World Bank historical inflation analysis |
| September 2022 | Global 12-month change in consumer prices, post-pandemic peak | 9.5% | IMF global inflation data |
| December 2024 | Global headline inflation | 4.8% | IMF global inflation data |
| July 2025 | Global headline inflation | 3.5% | IMF global inflation data |
| 2025 | Global headline inflation, estimate in the October 2026 outlook | 4.1% | IMF World Economic Outlook, October 2026 |
| 2026 | Global headline inflation, projection | 4.7% | IMF World Economic Outlook, October 2026 |
| 2027 | Global headline inflation, projection | 4.1% | IMF World Economic Outlook, October 2026 |
| September 2026 | OECD 38-country consumer price inflation, year over year | 4.5% | OECD consumer price inflation data |
The World Bank's two historical series place the 1974 annual average at 16.6% and 16.9%. The gap reflects differences between series, so the label and method matter alongside the value. The IMF figures also have distinct statuses: the past-month readings are observations, while the 2025 to 2027 outlook figures are an estimate and projections.
Before quoting a row, check its measure, period, scope, source series and status using the verification checklist at the end.
What a Global Inflation Rate Actually Measures
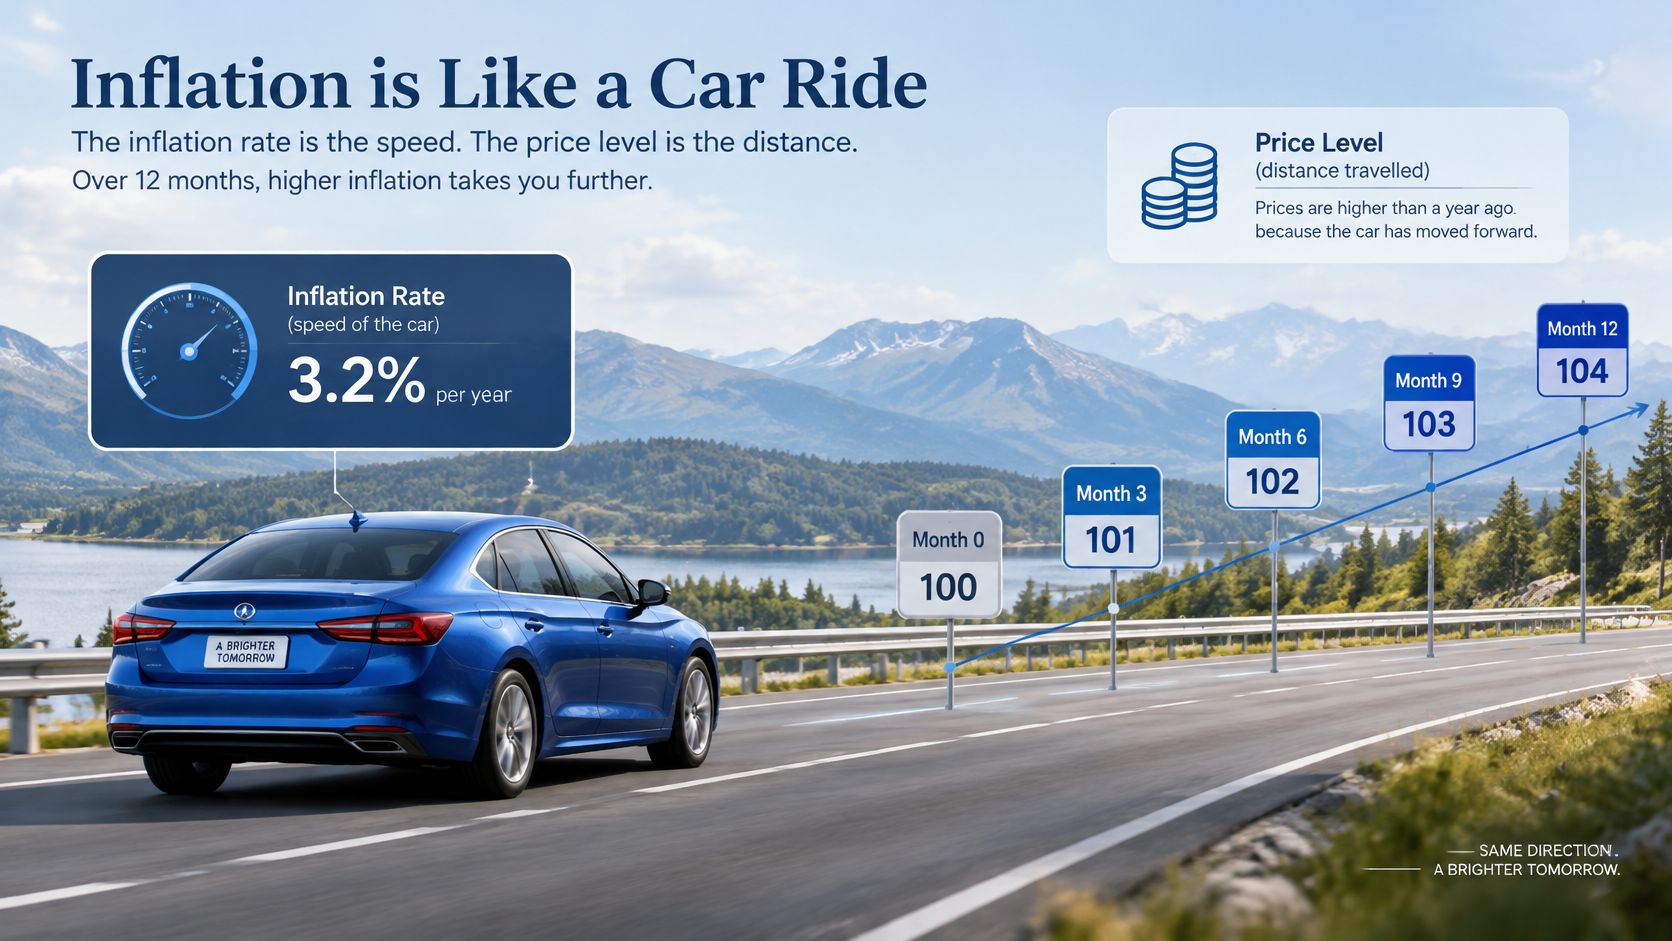
An inflation rate is like a car's speed, while the price level is the distance the car has travelled. The rate describes how quickly prices are rising over a chosen period. A lower rate means prices are increasing more slowly, not that they have returned to an earlier level.
Consider a grocery basket that costs 100 units one year and 104 the next. Its price has risen by 4%. If it costs 106 the following year, inflation has slowed because the increase is smaller, but the basket still costs more than it did in either earlier year. That slowdown is disinflation; deflation means prices fall.
What the global figure combines
The IMF defines global inflation as the 12-month change in consumer prices across economies. A global figure therefore summarizes price movements across countries rather than recording the experience of a single household or nation. The exact result also depends on how the underlying country figures are combined.
The World Bank's account of the 1970s uses the median across countries for some comparisons. A median gives the middle country rate after the rates are ordered, while a weighted average gives more influence to economies assigned larger weights. Those methods can produce different results, so a figure based on one shouldn't be compared casually with a figure based on the other.
A global rate may hold steady even as individual countries move in opposite directions. It can also differ from a household's personal inflation experience, because households buy different things in different proportions. Someone spending a large share of income on groceries and transport may face more pressure than someone whose main expenses are less affected by a particular price shock.
Three questions help establish what a quoted figure means: How fast are prices rising? Compared with which baseline? For which households or economies? Those checks distinguish a change in the rate from a change in the cost of living.
How Inflation Is Measured and Which Measure to Use
| Measure | What it covers | Why it moves differently |
|---|---|---|
| Headline CPI | All items in the consumer basket | Includes volatile energy and food prices |
| Core inflation | Consumer prices excluding food and energy | Shows persistent underlying pressure |
| Food inflation | Food and beverage prices | Driven by harvests, fertiliser costs and weather |
| Energy inflation | Fuel, electricity and gas prices | Reacts quickly to oil and gas shocks |
| Producer-price inflation | Prices received by producers | Can signal later consumer price moves through input costs |
| GDP deflator | Prices of all domestically produced goods and services | Broadest measure, based on output rather than household spending |
The World Bank's inflation database tracks these six measures at annual, quarterly and monthly frequencies across up to 209 countries through 2025. That coverage makes it possible to examine price movements by category and country instead of relying on one headline number.
Read measures side by side
Headline CPI is usually the most direct measure of changes in household consumer prices because it covers the full consumer basket. Core inflation excludes food and energy, two categories that can swing sharply, helping readers assess whether price pressure extends beyond those volatile items. But core inflation isn't a replacement for the household cost-of-living measure: it deliberately leaves out expenses that consumers still pay.
Food prices can respond to harvest conditions, fertiliser costs and weather. Energy prices can react rapidly to oil and gas disruptions, then feed into other costs through electricity, transport and production. Producer-price inflation tracks prices producers receive, while the GDP deflator covers domestically produced output rather than the consumer purchases represented by CPI. Neither directly describes a household's bills.
When headline inflation rises faster than core inflation, food or energy prices may be contributing to the gap. When both rise together, price pressure may be broader. These are reading cues, not proof of a single cause; the underlying country and category data still need checking.
For background on checking the wording and scope of a reported figure, consult this guide to how to read a survey statistic. For inflation, the practical choice is headline CPI for consumer costs, core inflation for the underlying trend, and the national statistics office's definition for the exact local measure.
Why One Global Number Hides Regional Gaps
A global inflation rate doesn't describe one shared price experience. The IMF's July 2025 outlook cautions that a global aggregate conceals major differences between economies. The same international shock can reach consumers through different combinations of food prices, energy costs, exchange rates and domestic price-setting.
The OECD's September 2026 consumer price release reported year-over-year inflation of 4.5% across its 38-country area, compared with 4.3% in August. Energy was the main driver: OECD energy inflation rose to 17.4% from 13.6%, and it increased in 31 of the 37 OECD countries with available data. This is an OECD-area CPI result, not a rate for every country or the whole world.
How a shock reaches households
An energy-price spike can raise transport and electricity costs first. Those costs can then affect food distribution and firms' production expenses; if households and businesses expect higher inflation to persist, wage and price-setting may spread the pressure into core prices. The size and timing of these effects depend on country conditions.
Consider two households facing the same national headline rate. One spends a large share of its budget on food and fuel; the other spends more on services that are less directly exposed to an energy shock. The headline measure can be accurate for the overall basket while failing to match either household's personal spending pattern.
Country comparisons require equally careful scope. The World Bank database tracks inflation measures for up to 209 countries through 2025, allowing analysis by country and category when the relevant series are selected. That reach supports comparisons, but it doesn't make every national figure directly interchangeable: countries can use different baskets, reporting periods and inflation measures.
A sound comparison starts with the IMF or World Bank group figures for advanced economies and emerging-market and developing economies. It then checks the country's national statistics office for the local measure, and compares that result with the country's peer group and its own matching series. A global number is useful context; it isn't a substitute for those local checks.
How Global Inflation Rates Changed Over Time
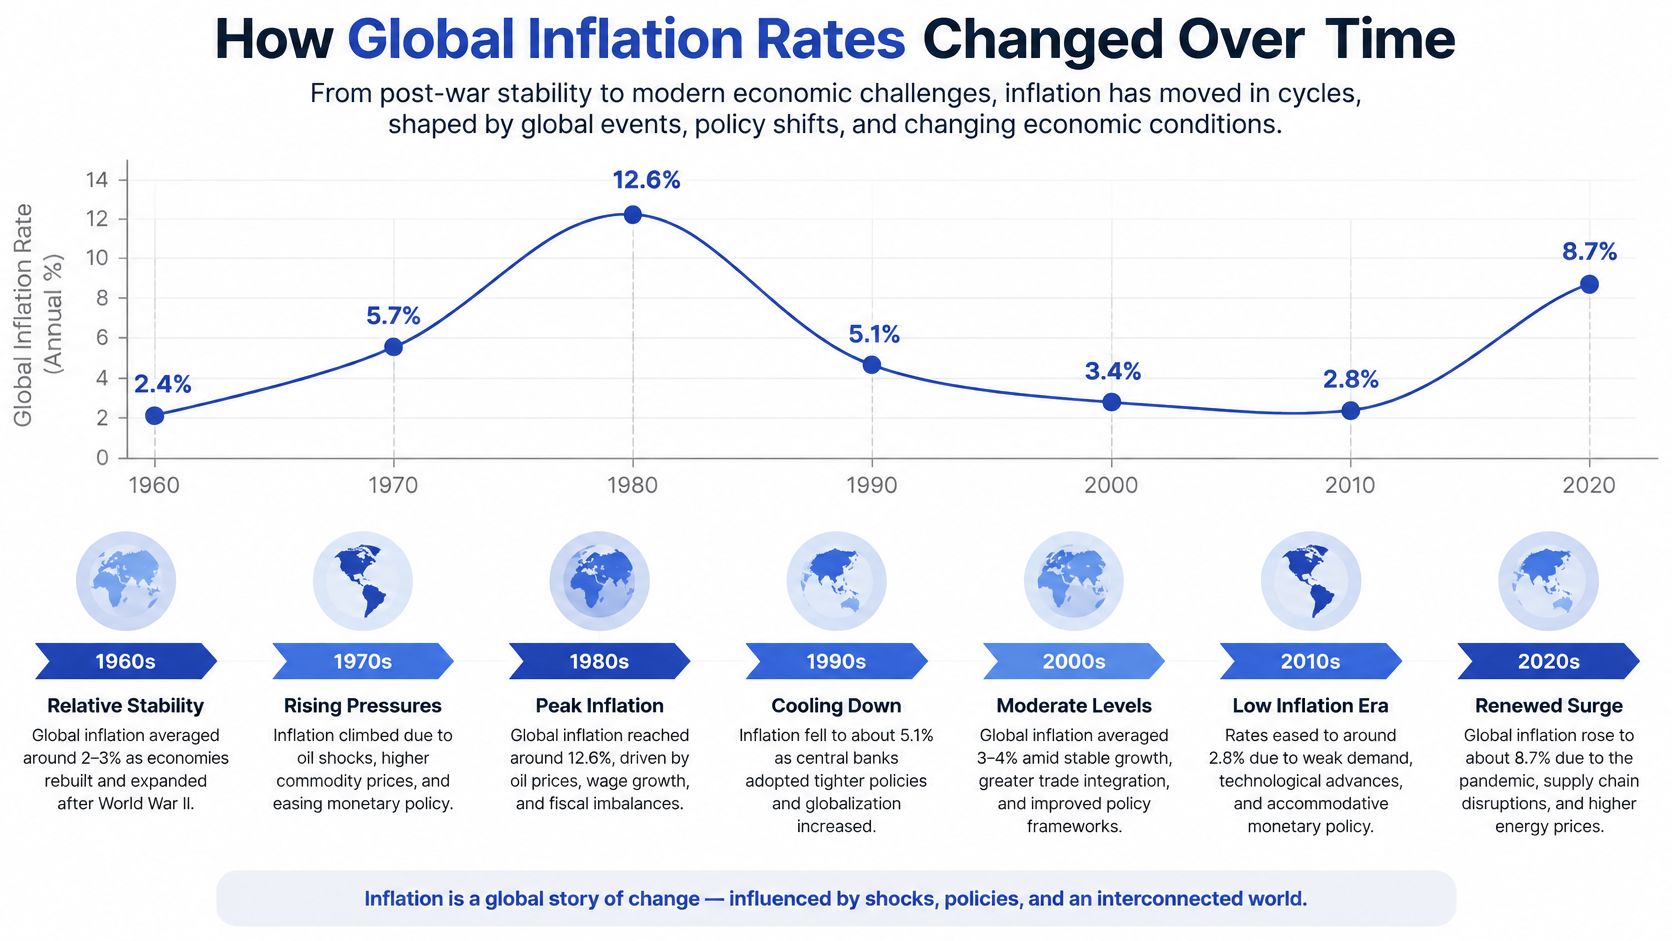
In the 1970s, two oil shocks coincided with a broad acceleration in prices. The World Bank's historical analysis reports that oil prices quadrupled in 1973 and doubled again in 1979 to 80. Median inflation across countries rose from 4.4% in 1970 to 13.6% in 1980, roughly tripling, while global inflation reached a 16.6% annual average peak in 1974 in the main World Bank series.
From tightening to low inflation
In the 1980s, monetary authorities, particularly in advanced economies, tightened policy to bring inflation down. The process reduced inflation over several years, but it also contributed to severe recessions. This history shows that a supply shock can lift prices quickly, while sustained restraint on monetary conditions may take time to lower the rate.
The low-inflation readings later in the timeline come from different World Bank series. The related historical series records 1.9% in 2015 and 2.5% in 2020, while the main series reports 2.6% in 2017. These points help mark a period of comparatively subdued global inflation, but they shouldn't be treated as adjacent observations in one uninterrupted series.
The pandemic-era episode then brought a sharp reversal. IMF data put the global 12-month change in consumer prices at 9.5% in September 2022, followed by 4.8% in December 2024 and 3.5% in July 2025. The surge followed pandemic-era supply disruptions, a strong demand recovery and increases in energy, food and other commodity prices; the decline that followed was gradual rather than an immediate return to earlier price levels.
For readers tracking public finances alongside prices, a country debt-to-GDP comparison offers a separate measure of fiscal conditions, not an inflation statistic. The distinction matters because inflation, economic output and government debt answer different questions even when they shape the same economic outlook.
The historical lesson is not that every shock produces the same path. It is that supply disruptions can accelerate inflation quickly, while lowering the rate can take years. When inflation falls, prices generally rise more slowly; that change alone does not undo earlier increases.
Where Global Inflation Is Heading in 2026 and 2027
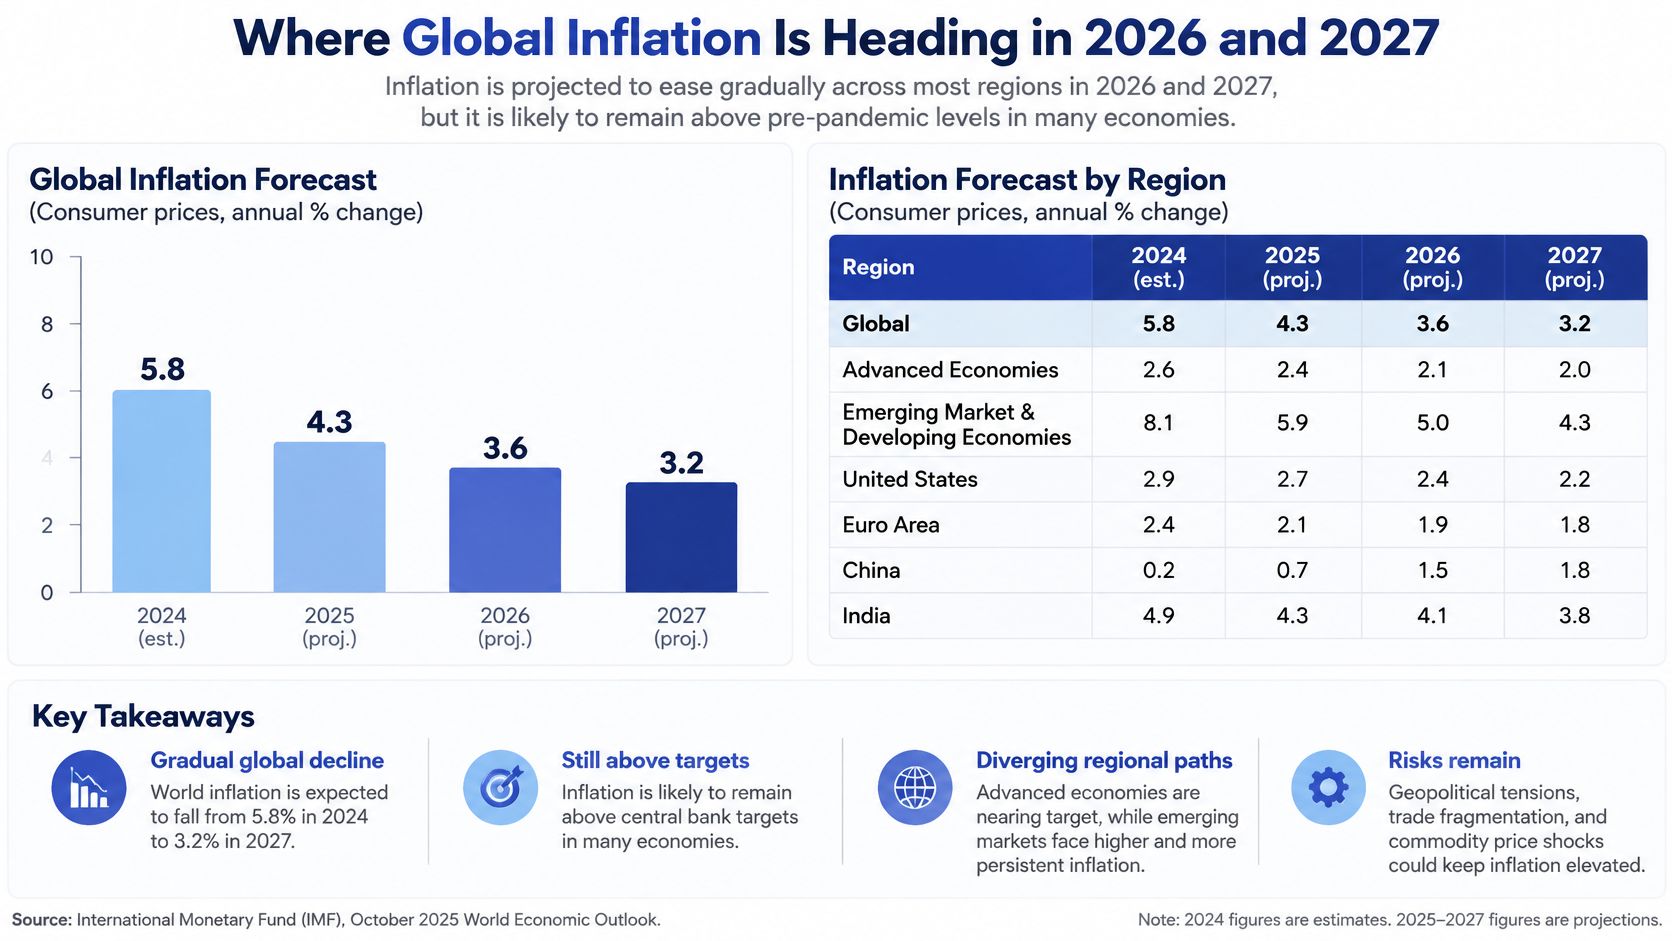
The IMF's October 2026 World Economic Outlook projects global headline inflation at 4.7% in 2026, up from 4.1% in 2025, before easing to 4.1% in 2027. The IMF attributes the temporary rise mainly to higher energy and food prices and expects the pass-through to core inflation to stay limited. The projections draw on statistical information available through October 1, 2026.
Two scope details shape how to read that path. The figure is a rate of change: at 4.1% in 2027, prices still rise, only more slowly than in 2026. And it is a headline measure, so the projected peak reflects the energy and food components rather than broad-based core pressure.
Turning the baseline into a planning range
The transmission mechanism runs through several steps. Higher energy prices raise costs for transport, electricity and production, and firms may pass part of those costs to customers. If households and businesses start expecting higher inflation to persist, wage negotiations and price-setting can spread the pressure into core inflation. The IMF's baseline assumes that broader pass-through stays limited.
An IMF scenario analysis shows how outcomes could differ under energy disruptions: the reference scenario pairs a short-lived conflict with a 19% increase in energy prices in 2026 and global headline inflation of 4.4%, while an adverse scenario with larger, more persistent energy increases, tighter financial conditions and higher inflation expectations puts inflation at 5.4% and global growth at 2.5%.
The roughly one-percentage-point gap between those two inflation outcomes gives analysts a stress-testing range for budgets, procurement and pricing assumptions. It remains a conditional band built on scenario assumptions. Because the scenario round predates the October baseline, the 4.4% reference case should be read on its own assumptions rather than treated as a revision of the 4.7% forecast.
The global average also conceals how unevenly one shock lands. Country outcomes hinge on energy-import exposure, exchange-rate pass-through, wage persistence and the share of services in the consumer basket. An energy importer with a weakening currency faces a different inflation path than an exporter with stable wage growth. Across every variant, these projections are model-based planning benchmarks, not observations of prices already recorded.
Check Scope and Source Before You Publish a Rate
A reliable inflation citation needs more than a percentage. Before using a figure, an editor can check five details:
- Measure: Is it headline CPI, core, food, energy, producer-price inflation or the GDP deflator?
- Period: Which month or year does the figure cover? The observation period may not match the release date.
- Scope: Does it describe the global aggregate, advanced economies, emerging-market and developing economies, the OECD area or one country?
- Source and series: Which statistical office or organization produced it, and which named series is being used? This is essential when the same publisher has more than one historical series.
- Status: Is the number observed, estimated or forecast? Check whether the source has revised it.
Apply the checks to one figure
A complete description would read: The IMF's October 2026 World Economic Outlook projects global headline inflation at 4.7% for 2026, based on statistical information available through October 1, 2026. That wording identifies the measure, forecast period, global scope, publisher, publication and information cutoff. It also makes clear that the figure is a projection rather than an observation.
For additional guidance on locating official releases, use this guide to official statistics sources. Statlyst collects figures from primary sources, including statistical offices, researchers and the organizations that ran the survey, without aggregators. Its figures carry the source wording and publisher, which helps editors preserve scope when citing a number.
Publication check: Open the original release, copy the exact measure wording, and link the publisher's page.
Corrections or questions about Statlyst's figures can be sent to editorial@statlyst.com. Before publishing a rate, verify the original source and keep the measure, period and scope beside the number so readers can interpret it accurately.
Editors preparing an inflation story can use this checklist to verify each figure before publication, then compare the country-level measure with its relevant peer group. For corrections or questions about Statlyst figures, contact editorial@statlyst.com.
Questions or corrections: editorial@statlyst.com