Guide · General
German Debt to GDP: Ratio, History and 2026 Outlook
German debt to GDP stood at 63.5% at end-2025 per Eurostat. Learn how it is calculated, how it changed since 1991, and what comes next.
By the Statlyst data desk · Updated November 6, 2026 · 13 min read
Germany's German debt to GDP ratio was 63.5% at the end of 2025, measured as general government gross debt, and that's above the EU's 60% Maastricht reference value. The number describes the whole public sector, not federal borrowing alone, and it only makes sense with its coverage and date attached.
That distinction matters more than the headline suggests. Two readers can both quote a German debt figure for the same year and still disagree, because one publisher's vintage, consolidation treatment or forecast status differs from another's. A rising ratio also doesn't settle the sustainability question on its own. Debt raised for investment that lifts future output behaves differently from debt raised for current consumption, even though both push the numerator up in the year the money's spent.
Table of Contents
- Germany's Debt-to-GDP Ratio and How It Reached 63.5 Percent
- How the Debt-to-GDP Ratio Is Calculated
- Why the Ratio Rises and Falls
- Germany Against the 60 Percent Benchmark and Official Forecasts
- What the Debt Brake Reform Means for the Path Ahead
- Check Coverage and Date Before You Use a German Debt Figure
Germany's Debt-to-GDP Ratio and How It Reached 63.5 Percent
63.5% was Germany's general government gross debt at the end of the fourth quarter of 2025, about €2.838 trillion, according to Eurostat's euro indicators release for Q4 2025. The same release puts the ratio 1.3 percentage points above the 62.2% recorded in the fourth quarter of 2024, and above the 63.0% recorded in the third quarter of 2025.
The headline moves with its definition. Coverage decides which governments count, the reference date decides which debt stock and GDP vintage apply, and forecast status decides whether the GDP denominator is final or estimated. Borrowing also tells no single story on its own. Debt that funds investment can lift future output while still raising the numerator in the year it is spent, so a higher ratio does not always mean weaker fiscal management.
Eurostat also reports the euro area aggregate at 87.8% of GDP at the end of 2025, which places Germany well below the currency bloc as a whole. That ranking is separate from compliance. Germany remains above the 60% Maastricht reference value, and that gap explains why a comparatively low figure still draws scrutiny.
Producer and vintage explain most small differences between sources. Different publishers release at different times and revise on different schedules. The table keeps each year's producer in its own column for that reason.
German general government debt-to-GDP ratio, key years
| Year | Debt-to-GDP ratio | General government debt | Primary source |
|---|---|---|---|
| 1991 | 39% | €618 billion (Maastricht debt) | Deutsche Bundesbank |
| 1999 | 60% | €1.239 trillion | Deutsche Bundesbank |
| 2008 | 65.9% | €1.642 trillion | Deutsche Bundesbank |
| 2017 | 64.1% | €2.093 trillion | Deutsche Bundesbank |
| 2023 | 63.7% | €2.62 trillion | Deutsche Bundesbank |
| 2024 | 62.5% (Bundesbank) / 62.2% (Eurostat) | €2.69 trillion | Deutsche Bundesbank; Eurostat via Council of the EU |
| 2025 | 63.5% | €2.838 trillion | Eurostat; Deutsche Bundesbank |
Reunification and the climb to 60 percent
The first phase runs from reunification to the end of the 1990s. According to Deutsche Bundesbank Maastricht data for 1991 to 1999, Germany's Maastricht debt amounted to €618 billion in 1991, equivalent to 39% of GDP, and by 1999 debt had reached €1.239 trillion with the ratio at 60% of GDP.
The Bundesbank attributes much of that increase to the financial costs associated with German reunification. That was a structural break, not a normal budget cycle. The state absorbed liabilities and commitments that raised the stock of debt faster than output grew, so the ratio moved by roughly twenty points within a decade.
The UMTS dip, then persistent deficits
The second phase is brief. The ratio fell to 58% in 2001, helped partly by revenue from UMTS mobile license auctions. One-off receipts lower the numerator without changing recurring spending and revenue.
Persistent deficits then kept Germany above the 60% reference value from 2003 onward. When deficits repeat, the debt stock grows even in calm years. Nominal GDP must then grow fast enough for the ratio only to stand still.
Financial crisis, peak and gradual decline
During the global financial crisis, general government debt reached €1.642 trillion at the end of 2008, equal to 65.9% of GDP. Bank support, weaker revenue and stimulus added to debt while output contracted. Both sides of the division pushed the ratio higher at once.
The longer historical series published in the Deutsche Bundesbank Maastricht data for 1991 to 1999 shows a peak of approximately 81% of GDP in 2010, followed by a gradual reduction. By the end of 2017, debt stood at €2.093 trillion, or 64.1% of GDP. Later rows show the ratio settling in the low sixties rather than returning below the reference value.
The 60% line is the benchmark every figure in this article is measured against, and Germany has spent most of the period since 2003 above it.
That history puts the current 63.5% in context. It sits far below the 2010 peak and below the euro area aggregate, yet above the treaty value, with the 2025 movement pointing upward.
How the Debt-to-GDP Ratio Is Calculated
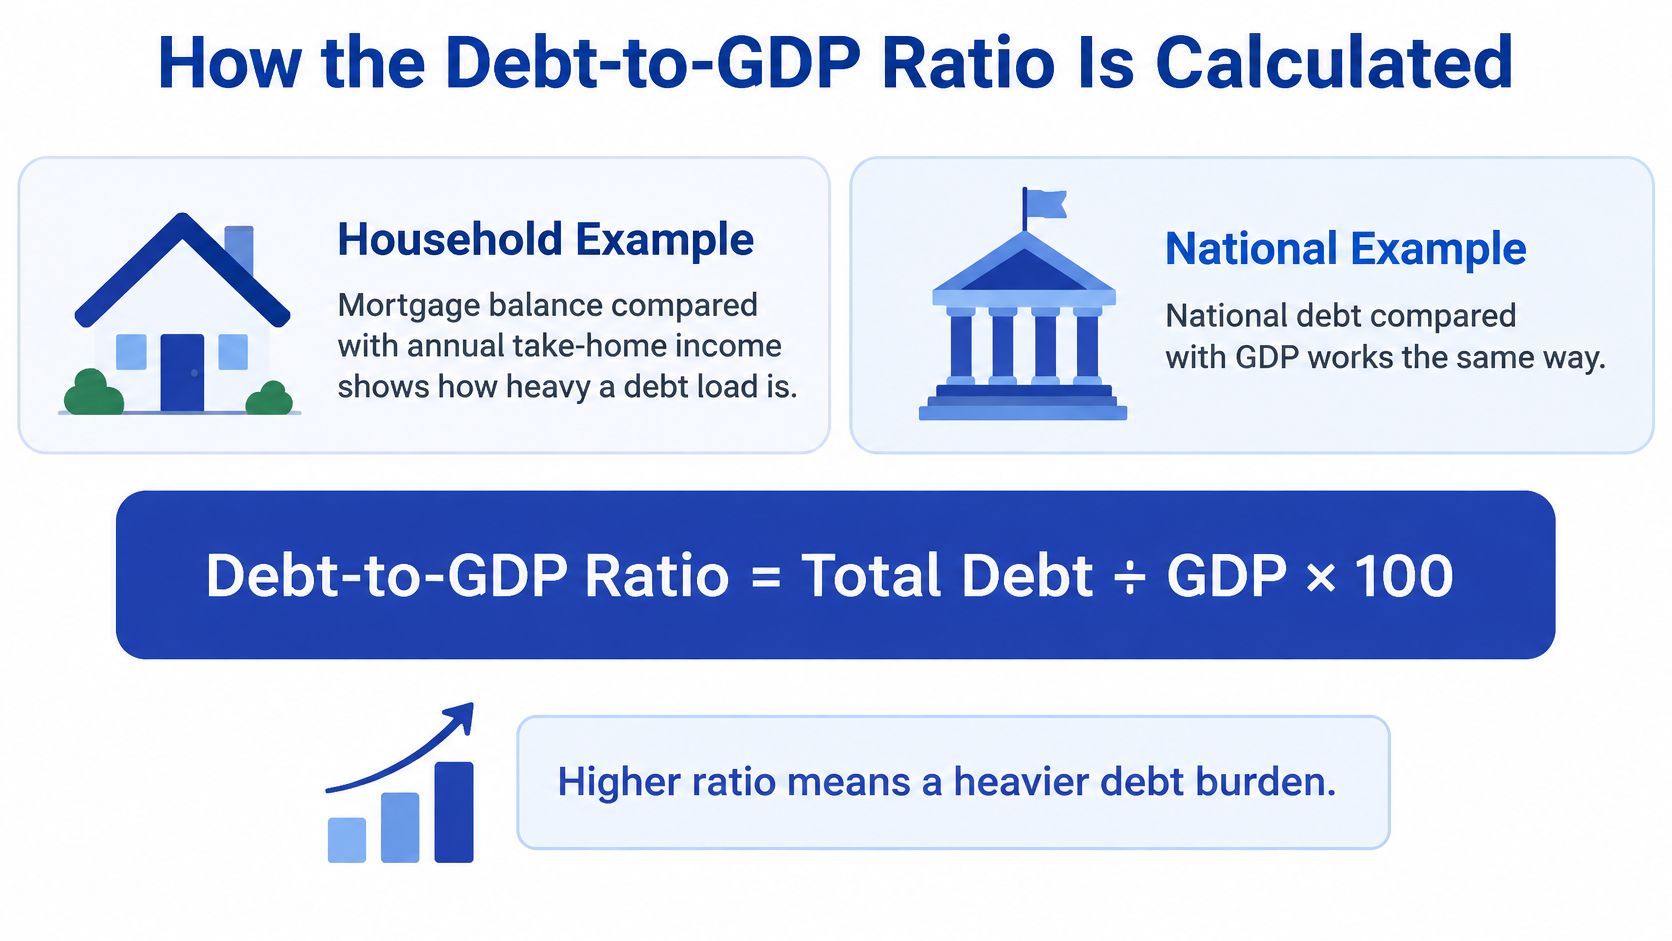
The ratio compresses a stock and a flow into one number. A mortgage balance measured against annual take-home pay shows the same relationship: the liability exists at a point in time, while income is earned over a year. For Germany, government debt replaces the mortgage and nominal economic output replaces income, so the result expresses the burden relative to the size of the economy.
Debt-to-GDP ratio = general government gross debt ÷ nominal GDP × 100
The numerator covers the whole public sector
The numerator uses the Maastricht measure of consolidated gross debt for Germany's general-government sector, covering the federal, state, local and social-security subsectors, according to a Council of the European Union document citing Eurostat data. A federal-debt figure has narrower coverage and will read lower, so it cannot stand in for the national measure.
Consolidation strips out debt that one government unit owes to another, avoiding double counting. Gross means liabilities are not reduced by the financial assets the state holds. Asset ownership can therefore coexist with a high gross ratio. The first check on any quoted German figure is its coverage: consolidated, gross and all four subsectors.
The denominator is nominal GDP
The denominator is nominal GDP in euros for the relevant year. Real output growth increases it, and so does inflation; weak output can reduce it even when borrowing does not change. For that reason, the same debt stock can produce different ratios after GDP revisions or when figures are taken from different reference dates.
The denominator also shapes interpretation. Borrowing that finances productive investment may expand future economic capacity or revenue, so a rise in the ratio is not by itself proof of fiscal deterioration. The number records how debt compares with current output, not whether every euro borrowed was wasted.
The deficit is only one part of the debt change
The annual deficit is the most familiar reason debt rises, but it does not account for every movement in the debt stock. Stock-flow adjustments such as valuation effects and transactions involving financial assets can open a gap between the deficit and the change in debt. Readers who expect debt to rise by exactly the size of the deficit will find a residual, and the stock-flow adjustment is where that residual sits.
A usable citation therefore needs the measure wording, producer, data year, reference date and forecast vintage. A provisional estimate, a forecast for an unfinished year and a later release after GDP revisions can describe different stages in the data process. Anyone quoting a German ratio should copy those fields together, following the steps in Statlyst's guide to citing statistics.
Why the Ratio Rises and Falls
The ratio moves when debt grows, when the economy grows, or when both happen at different speeds. Germany in 2025 is a clean worked example because the two forces pulled in opposite directions and the debt side won.
The 2025 decomposition in plain arithmetic
Nominal GDP growth lowered the ratio by 2.0 percentage points, while debt accumulation increased it by 3.3 percentage points, producing a net rise of 1.3 points from 62.2% in 2024 to 63.5% in 2025, according to the IMF DataMapper profile for Germany. The deterioration came from the numerator growing substantially faster than the denominator, rather than from weak nominal GDP alone.
Central-government borrowing, including off-budget entities, carries most of the weight inside that debt increase. The consolidated measure covers every level of government, yet federal policy decisions account for the bulk of the movement in the numerator, so a reader tracing why the ratio rose should look first at central government rather than at local authorities.
Say nominal GDP had grown fast enough to take another two points off the ratio while borrowing stayed where it was. The headline would have fallen, and coverage would have read it as fiscal improvement, even though the state owed exactly as many euros as before. The ratio rewards growth as much as it rewards restraint. The mirror image holds as well: a rising ratio can reflect borrowing that finances productive investment and expands future output, so the direction of the number alone does not diagnose fiscal health.
A deficit is a flow, debt is a stock
Germany's general-government deficit was EUR 118.8 billion in 2024, equal to 2.8% of GDP at current prices, according to the Federal Statistical Office press release. That deficit ratio was higher than the 2.5% recorded in 2023, yet it still sat below the EU's 3% deficit reference value in that year.
A deficit is recorded across the year, while the debt ratio is measured at year-end. The deficit adds to the stock, yet the stock also responds to nominal growth and to transactions the annual deficit never captures. Conflating the two is a frequent error in coverage of German public finances, and it is the error that makes a modest deficit look inconsistent with a rising ratio.
Analysts therefore track the levers separately: nominal GDP growth, the primary balance, interest expenditure and debt-financed spending by central and off-budget entities. Each moves the numerator or the denominator through a different channel, so no single figure predicts next year's ratio. Readers comparing public debt with private balance sheets can use Statlyst's household debt statistics to keep the two concepts apart, since households face the same stock-versus-flow distinction at a smaller scale.
Germany Against the 60 Percent Benchmark and Official Forecasts
The benchmark comes from the EU Treaty framework and applies to consolidated gross debt for the entire general-government sector. Germany was 3.5 percentage points above the 60% reference value in 2025 at 63.5% of GDP, according to the Federal Statistical Office European comparison. That page also distinguishes the debt limit from the separate deficit limit, which is assessed against a 3% of GDP reference value.
The euro area aggregate at the end of 2025 sits far above Germany's reading. Germany still looks low beside its peers, yet ranking well inside a group of high-debt countries and meeting a treaty threshold are different claims. Only the second one is a legal benchmark.
Germany's debt-to-GDP outturns, forecasts and the EU benchmark
| Source | Year | Debt-to-GDP ratio | Status |
|---|---|---|---|
| Eurostat, end-2025 outturn | 2025 | 63.5% | Realised |
| Euro area aggregate, end-2025 | 2025 | 87.8% | Realised, for comparison |
| EU Treaty reference value | Any year | 60% | Benchmark |
| European Commission, Spring 2026 Forecast | 2026 | 65.8% | Forecast |
| European Commission, Spring 2026 Forecast | 2027 | 68.0% | Forecast |
What the forecasts actually say
The European Commission's Spring 2026 Forecast projects Germany's general-government debt ratio at 65.8% of GDP at the end of 2026 and 68.0% at the end of 2027, according to the Official Journal text of the forecast. Relative to the 63.5% recorded at the end of 2025, those projections imply increases of 2.3 percentage points in 2026 and a further 2.2 percentage points in 2027, mainly reflecting higher primary deficits.
Those are conditional values tied to the policy measures known at the forecast cut-off date. A later budget decision can move them, and so can a revision to GDP. An autumn vintage of the same forecast would work from a different information set, so two official projections for the same year can legitimately diverge.
Why two official numbers can both be right
The Bundesbank reported debt of €2.84 trillion, equal to 63.5% of GDP, at the end of 2025, up from €2.694 trillion and 62.5% in 2024, according to the Deutsche Bundesbank press release on German government debt. Official figures vary because they use different cut-off dates and assumptions: realised debt, forecasts and broader scenarios can incorporate different borrowing plans, GDP assumptions and treatment of special funds.
Coverage date and forecast vintage therefore belong in the sentence with the number. A reader comparing a realised 2025 outturn with a Spring 2026 forecast for 2027 is comparing a measurement with a conditional projection, and the gap between them is not evidence that either producer erred. Statlyst applies the same convention to its own datasets: on its Hybrid Work Statistics 2026 page, 43% of the figures come from official or research sources, and each figure carries the publisher and data year beside the value.
What the Debt Brake Reform Means for the Path Ahead
A rising ratio is often read as fiscal failure. That reflex is too fast, because it ignores what the borrowed money buys. Borrowing that raises the economy's productive capacity can enlarge the denominator in later years, while borrowing that funds current consumption leaves only the interest bill behind.

What changed in March 2025
The debt brake was significantly relaxed in March 2025, and according to the Bundesbank as reported in the European Commission assessment of Germany, central government received unlimited borrowing scope for defence and security spending above 1% of GDP, a €500 billion infrastructure and climate-neutrality fund was placed outside the ordinary debt-brake ceiling, and state governments may plan structural borrowing of up to 0.35% of GDP annually. The Commission's assessment also states that Germany's 2025 ratio exceeded the 60% reference value and that the conditions for discounting relevant factors were not met.
That institutional change is why the projected path steepens rather than flattening. Spending that used to require offsetting savings can now be debt-financed by design.
When the borrowing pays back, and when it doesn't
The European Commission estimates the fund equals 11.6% of 2024 GDP and puts the ratio only about 0.5 percentage points above baseline in 2029 but 3.25 percentage points above baseline by 2035, according to the Bundesbank Monthly Report article on public finances. The fund runs over 12 years, so the debt arrives on a schedule while any productivity gain arrives on a slower and less certain one.
Three conditions decide whether the trade works:
- Return above cost: investment has to raise potential output by more than the interest it adds, or the ratio keeps climbing after the projects finish.
- Timing of gains: slow GDP gains leave several years in which debt has risen and output hasn't, which is when the ratio looks worst.
- Composition of spending: money directed to low-return projects or current consumption worsens the trajectory even if the total borrowed is identical.
Judge the composition of the borrowing and the growth-adjusted interest burden, not the level of debt or the size of the deficit alone.
Higher interest costs are the risk that compounds through refinancing. If the state rolls maturing debt at higher rates while the new investment is still being built, interest expenditure rises before revenue does, and the primary balance has to work harder just to stabilise the ratio.
Check Coverage and Date Before You Use a German Debt Figure
Six checks take under a minute and prevent most miscitations of German debt to GDP.
- Confirm the coverage: general government gross debt, the headline Maastricht measure, or federal debt only.
- Confirm the basis: gross liabilities, not net of financial assets.
- Confirm the reference date: year-end outturn, a specific quarter, or a forecast year.
- Confirm the status: realised figure, Commission forecast, or government draft plan.
- Confirm the forecast vintage: the cut-off date of the forecast, before comparing it with another producer's number.
- Trace the producer: Eurostat, the Federal Statistical Office, the Deutsche Bundesbank or the European Commission, and copy the exact measure wording they use.
Readers who need help telling a primary producer from an aggregator can work through Statlyst's official statistics sources guide before citing. The citation to write is Germany's general government gross debt at 63.5% of GDP at the end of 2025, with any later figure labelled by status and vintage, so the number means the same thing to the reader as it did to the office that produced it.
Search Statlyst's statistics library for the German debt figure with its primary source, data year and exact measure wording attached, then download the underlying figures as a free CSV for reporting, coursework or board papers.
Questions or corrections: editorial@statlyst.com