Guide · General
Labor Productivity Formula: How to Calculate It Correctly
The labor productivity formula divides output by hours worked. See the inputs, worked examples and the traps that distort productivity claims.
By the Statlyst data desk · Updated November 8, 2026 · 12 min read
Labor productivity equals output divided by total hours worked, with the OECD definition set as GDP divided by total hours worked for the total economy. That single ratio states how much economic output each hour of labor generates.
If the calculation is that simple, why do correct figures still produce wrong headlines about workers? A rise in output per hour can reflect new software, machinery, training or a shift toward full-time staff, while individual effort changes little. The error isn't usually division. It's treating a ratio for a whole production system as a score for the people inside it, then quoting the result without naming the numerator, denominator, period and price basis.
Table of Contents
- The Labor Productivity Formula in One Line
- Three Versions of the Formula and When to Use Each
- Calculate Labor Productivity Step by Step and Verify the Source
- Worked Examples from a Firm to a Quarterly Release
- Interpretation Traps That Distort Productivity Claims
- What the Ratio Cannot Show About Technology and Effort
The Labor Productivity Formula in One Line
Labor productivity = output ÷ total hours worked. The OECD Compendium of Productivity Indicators 2019 defines labour productivity as GDP ÷ total hours worked, a measure that expresses the amount of economic output generated by each hour of labour. Its scope is the total economy, and its GDP measure is gross value added at market prices.

The denominator is total hours worked, not a headcount of employees. That total includes hours worked by full-time and part-time employees, paid and unpaid overtime, and hours worked in additional jobs. It excludes time not worked because of public holidays, paid leave, strikes and labour disputes, bad weather, and economic conditions.
Reading the Ratio Through a Bakery
Say a bakery produces loaves each morning. The ovens and recipes stand for capital and technology, the bakers supply the labor, and loaves per hour is the output rate. A faster oven can lift loaves per hour even if the bakers work at the same pace and follow the same method.
That distinction travels directly to national figures. Output per hour describes the combined system of labor, equipment, ingredients and organization, not the speed of any one baker. A writer who credits the bakers alone has already moved beyond what the labor productivity formula can support.
For international level comparisons, national-currency GDP at current prices is converted into US dollars using purchasing power parities. Without that conversion, exchange rate movements can look like productivity differences. The reference framework is the System of National Accounts 2008, which treats hours worked as the labour input effectively used in production.
Two numbers don't make a comparable ratio until they share the same period, scope and units.
That's the test to apply before any division. GDP from one territory divided by hours from a narrower workforce, or output for a year divided by hours for a quarter, produces a number with no defined meaning.
Three Versions of the Formula and When to Use Each
| Measure | Formula | Labor input | Best used for |
|---|---|---|---|
| Output per worker | Output ÷ number of workers | Headcount of employees or jobs | Quick firm comparisons where hours are similar |
| Output per hour | Output ÷ total hours worked | Total hours actually worked | Comparing firms, sectors or years with different part-time shares |
| Real output per hour | Real output ÷ total hours worked | Total hours actually worked, with output adjusted for prices | National and cross-country analysis, such as OECD and Eurostat indicators |
Output per worker divides output by the number of employees or jobs. It's quick because headcounts sit in payroll records and annual reports, and it works for a rough check inside one firm where working patterns stay stable. The common mistake is comparing two workforces with different part-time shares, since a job filled for a few hours a week counts the same as a full-time job in the headcount.
Output per hour replaces the headcount with total hours worked, so part-time and full-time hours enter on the same basis. Statistical offices prefer hours-based measures for cross-country work because workforce composition differs sharply between economies. The common mistake here is using paid hours or contracted hours instead of hours worked, which inflates the denominator with leave and holidays that produced no output.
Why the Three Versions Can Disagree
Real output per hour also adjusts the numerator for price changes, so the figure tracks the volume of output rather than inflation. A firm can report higher revenue per hour because it raised prices, while the quantity produced per hour didn't move. The common mistake is tracking nominal revenue per hour over several years and calling the increase a productivity gain.
The versions can point in different directions in the same year. Say a firm hires additional part-time staff and total output rises slightly. Output per worker can fall because the headcount grew faster than output, while output per hour holds steady because total hours grew only a little. Neither figure is wrong, but only the hours-based figure answers a question about output relative to labor time used.
Price adjustment adds a second possible split. If prices rise faster than volumes, nominal output per hour climbs while real output per hour stays flat or falls. A headline built on the nominal figure would report a productivity gain that customers never received as extra goods or services.
Practical rule: Use output per hour for comparisons, output per worker only for quick headcount checks where hours are similar, and real output per hour whenever output is measured in money over time.
Calculate Labor Productivity Step by Step and Verify the Source
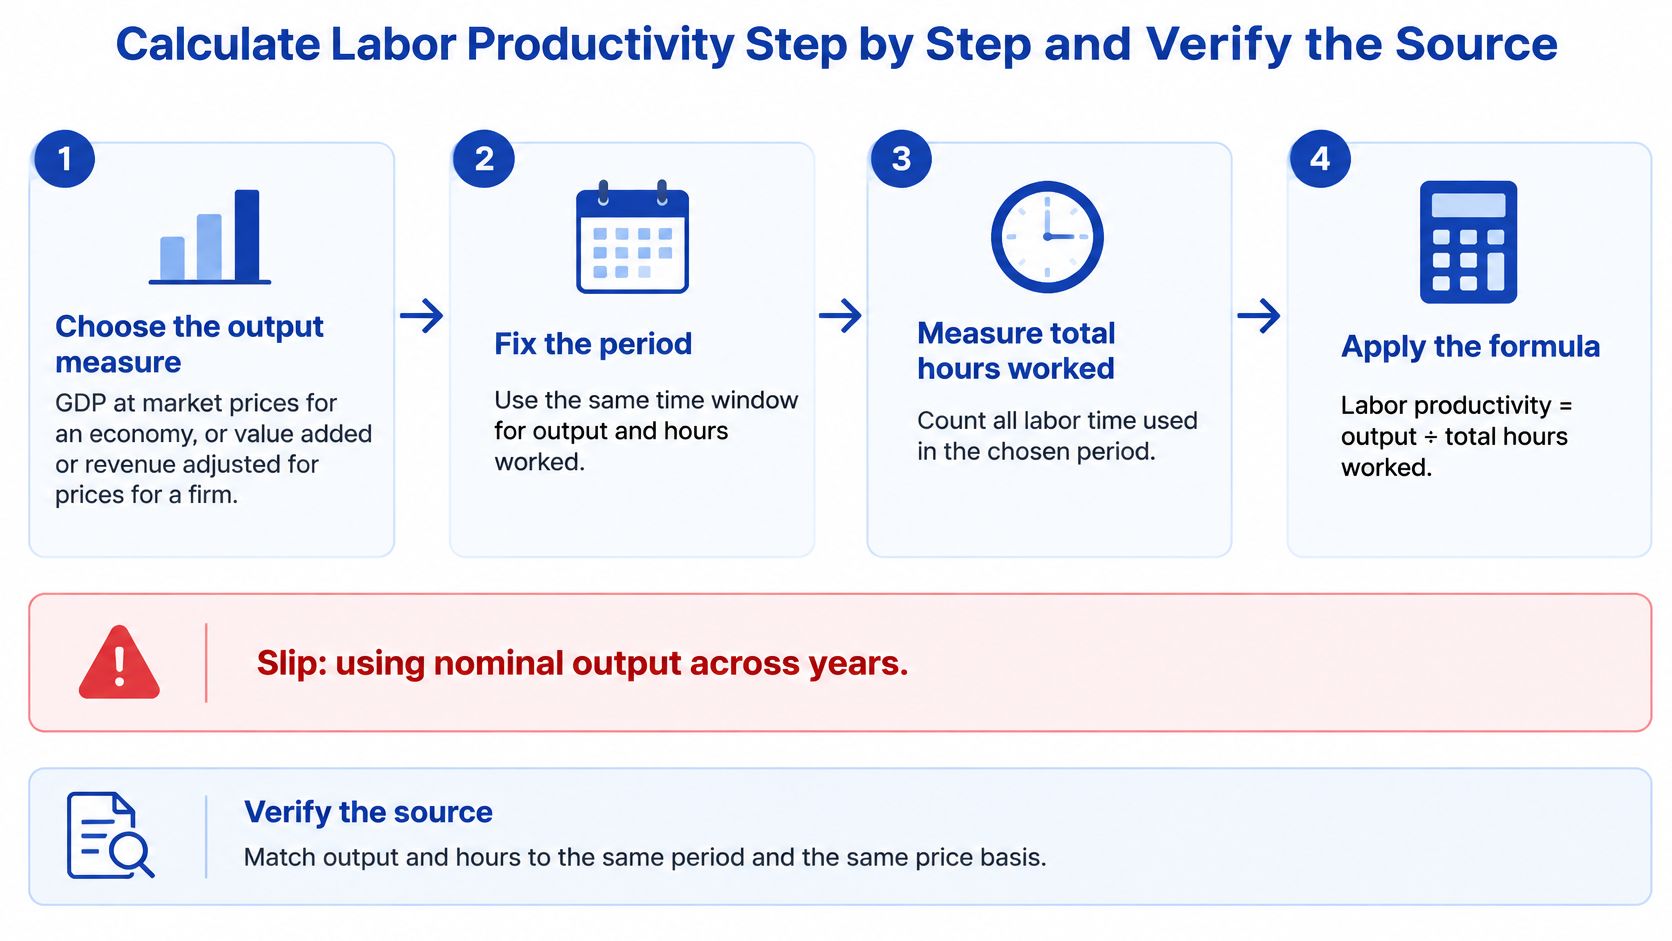
Steps One and Two Cover Output and Period
- Choose the output measure. For an economy, that's GDP at market prices. For a firm, value added works better than gross revenue because revenue counts purchased inputs the firm didn't produce, though revenue adjusted for prices is acceptable when value added isn't available. The slip is using nominal output across years, which lets inflation masquerade as extra output.
- Fix the period. Pick a quarter or a year and take output and hours from that same window. The slip is mixing a quarterly output series with an annual hours series, which produces a ratio that matches no real interval.
The period decision also sets how results should be compared. Quarterly figures move with seasonal patterns in retail, construction and agriculture, so quarter-to-quarter claims need seasonally adjusted series where publishers provide them. Annual figures smooth those patterns but hide turning points within the year.
Steps Three and Four Cover Labor Input and Prices
- Measure total hours worked. Count paid and unpaid overtime and hours in second jobs, and exclude public holidays and paid leave. The slip is substituting paid hours, which credits time that produced nothing. When actual-hours data aren't available, the approximation used needs naming in the published claim, since readers can't judge the gap otherwise.
- Convert output to real terms. Apply a price index or use chain-linked volumes, and state the reference year. The slip is comparing a real series from one publisher with a nominal series from another because both carry the same headline label.
Hours data deserve the most scrutiny because they're the hardest input to observe directly. Payroll systems record paid time well, but unpaid overtime, second jobs and time away from work often come from surveys with their own scope and sampling rules. A careful calculation states which source supplied the hours and whether those hours cover employees only or employees plus self-employed workers.
Steps Five and Six Cover Division and Comparison
- Divide real output by total hours and state the unit, such as dollars per hour. A productivity figure without a unit can't be checked or compared.
- Compare only with the same measure in other periods, using seasonally adjusted series where published. In United States releases, the Bureau of Labor Statistics seasonally adjusts the hours series, and the Bureau of Economic Analysis publishes the inflation-adjusted output series used with it, so a quote should name both the sector and the adjustment basis.
Switching measures mid-comparison is the quietest way to manufacture a trend. Output per worker in one year set against output per hour in the next will move even if nothing in production changed, purely because the denominator changed definition. Consistency of definition matters more than decimal places.
Verifying a Figure Before Quoting It
Verification starts at the original release, not at a secondary summary. The official statistics sources guide sets out how to trace a figure to its publisher, whether that's the Bureau of Labor Statistics and the Bureau of Economic Analysis for United States figures, the OECD for cross-country indicators, Eurostat for EU comparisons, or the ILO for definitions. The reader copies the exact wording of the measure, then confirms the data year, the scope, whether the figure is real or nominal, and whether a revision has replaced the first estimate.
That discipline mirrors how a statistics library should present sourced figures. Each figure on Statlyst's Hybrid Work Statistics 2026 page links to the statistical office, survey team or company that produced it, and the page offers a CSV download, a citation option and an 'Open in explorer' option for its data. Those features let a reader move from a quoted number back to its origin without guesswork.
Verification check: Recalculate one published figure from its source components. The result should match the published figure within rounding.
If the recalculation doesn't match, the discrepancy usually sits in scope, period or price basis rather than arithmetic. Resolving it before publication is cheaper than correcting a quoted figure afterward.
Worked Examples from a Firm to a Quarterly Release
A hypothetical firm reports value added of 2,400,000 over 40,000 hours worked in year 1. Dividing gives 60 per hour. In year 2, value added rises to 2,640,000 and hours rise to 42,000, giving 62.86 per hour, about 4.8% higher.
| Case | Output | Labor input | Labor productivity |
|---|---|---|---|
| Hypothetical firm, year 1 | Value added of 2,400,000 | 40,000 hours worked | 60 per hour |
| Hypothetical firm, year 2 | Value added of 2,640,000 | 42,000 hours worked | 62.86 per hour |
| U.S. nonfarm business, Q3 2025 (BLS) | Output up 5.4% | Hours worked up 0.5% | Productivity up 4.9% |
The Growth Shortcut Behind the Table
Productivity growth is roughly output growth minus hours growth. In the firm example, output grew 10% while hours grew 5%, so the shortcut predicts about 5% productivity growth. The exact division gives about 4.8%, close enough for a sanity check but not a substitute for the ratio itself.
The shortcut works because a ratio's growth rate approximates the difference between the growth rates of its parts. It fails as a reporting method when growth rates are large, since the approximation error grows with them. Published claims should carry the divided figure, with the subtraction kept as a check.
The Same Arithmetic in a Published Release
The pattern holds in official data. The U.S. Bureau of Labor Statistics release reported that in the third quarter of 2025, U.S. nonfarm business labor productivity increased 4.9%, with output up 5.4% and hours worked up 0.5%. Subtracting hours growth from output growth gives 4.9%, matching the published figure.
The two examples differ in status, and the wording should say so. The firm figures are hypothetical and exist only to show the arithmetic, while the Bureau of Labor Statistics figures are published data for a named sector, the U.S. nonfarm business sector, in a named period. Mixing those statuses in one sentence invites readers to treat an illustration as evidence.
Run the subtraction check on any reported figure. If output growth minus hours growth doesn't roughly match reported productivity growth, check the sector, the period and whether the series is seasonally adjusted.
Interpretation Traps That Distort Productivity Claims
If productivity rises, did employees become more productive? Not necessarily, and that single question exposes the most common misreading of the labor productivity formula. The ILO guidance on labor productivity defines labor productivity as output per unit of labor input, with output commonly measured as GDP and labor input preferably measured as total hours worked, while the OECD cautions that labor productivity is a partial productivity measure reflecting capital, technology, organizational practices and worker characteristics.
Four Traps and Their Corrections
- Confusing the ratio with worker effort: A company invests in software, output per hour rises, and the labor contribution barely changes. The correction is to attribute the rise to the combined inputs, since the ratio also reflects intermediate goods and organization alongside labor.
- Headcount instead of hours: A firm adds part-time workers and output per worker falls while output per hour holds steady. The correction is to use hours for any comparison where working patterns differ.
- Paid hours instead of actual hours: Paid hours include leave and holidays, which distorts comparisons across countries and sectors with different leave entitlements. The correction is to use total hours worked, while noting that hours data are often unavailable and countries may use more approximate measures, so part of an international gap may reflect method rather than performance.
- Cross-country levels without adjustment: Comparing GDP per hour in national currencies, or without checking workforce composition, turns currency and staffing differences into apparent productivity gaps. The correction is to convert using purchasing power parities and check the workforce mix.
Composition effects deserve attention in workplace reporting as well. Coverage of remote and hybrid work in numbers often compares output across groups whose hours, roles and part-time shares differ, which can move a per-worker figure without any change in output per hour. Naming the denominator prevents a staffing pattern from being reported as a performance result.
Before making any claim, state the numerator, the denominator, the period, the scope, and whether the figure is nominal or real.
A claim that can't fill in those five items isn't ready to publish. The arithmetic may be correct, but the sentence built on it will claim more than the ratio shows.
What the Ratio Cannot Show About Technology and Effort
Technology adoption and measured output can move apart for a long time. The Federal Reserve Bank of St. Louis published U.S. survey evidence in its November 2025 review of generative AI adoption. The Federal Reserve Bank of St. Louis article reported that generative-AI use accounted for 5.7% of work hours in August 2025, up from 4.1% in November 2024, and that across all workers, reported time savings equaled 1.6% of total work hours.

Those figures describe use and self-reported time savings in the United States. They don't directly establish a corresponding increase in GDP per hour, because saved time may be redirected to lower-value tasks, personal activity, or previously unmeasured work. Gains from reorganizing jobs or investing in complementary capital may also take longer to appear in national accounts.
Four Measures That Should Not Be Merged
- Task-level productivity: Output on one defined task, such as drafts completed per hour.
- Employee-reported time savings: Time workers say a tool saved, whether or not output rose.
- Firm revenue per hour: A money-based firm ratio that also moves with prices and product mix.
- Economy-wide real GDP per hour: The national accounts measure built from real output and total hours worked.
The bakery analogy clarifies the gap. A faster oven has clear potential, but if it sits idle while the bakery rebuilds its shifts, retrains staff and rewrites its schedule, loaves per hour won't rise until the reorganization finishes. The formula records realized output during that interval, not the oven's capability.
Reporting on AI in the workplace statistics faces the same separation problem, since adoption rates, time savings and output per hour answer different questions. High adoption and weak aggregate productivity growth can coexist temporarily without either figure being wrong. Each measures a different stage between acquiring a tool and producing more output per hour across an economy.
The writer's rule follows directly. Never treat an AI usage rate as a productivity growth rate, and name which of the four measures a claim refers to before attaching a percentage to it.
Readers quoting a productivity figure should start from the primary release, copy the exact measure, sector, period and price basis, and rerun the subtraction check before publication. Statlyst's statistics library supports that habit with figures linked to their original publishers and data years, so the next labor productivity formula claim can be cited to its source rather than repeated from a headline.
Questions or corrections: editorial@statlyst.com