Guide · General
How to Cite a Chart: Steps for APA, MLA and Chicago
Learn how to cite a chart in APA, MLA and Chicago, with the figure label, source note, reference entry and checks that make the number verifiable.
By the Statlyst data desk · Updated November 13, 2026 · 11 min read

A chart can carry a tidy source line, name a well-known website, and still be impossible to check. The line tells a reader where the chart was seen, not who produced the number, which year it describes, or which population it covers. That gap separates a citation that decorates a page from one that lets a colleague open the original table and confirm the figure.
Treat a chart citation as a small piece of data infrastructure: producer, release, measure, period, population, link. Style rules matter, and APA, MLA and Chicago each handle figures differently, but style sits on top of that structure. Get the structure right and formatting takes minutes. Skip it and no amount of correct punctuation will rescue the number.
Table of Contents
- What Every Chart Citation Must Include
- How to Cite a Chart Step by Step
- Referencing, Reproducing or Redrawing a Chart
- Chart Citation Formats in APA, MLA and Chicago
- Mistakes, Checks and the Fix or Drop Decision
What Every Chart Citation Must Include
A caption that says only "Source: ONS" credits a publisher and stops there. A reader who wants to verify the figure still cannot tell which release it came from, which period it covers, or which population it measures.
The complete version answers six questions, and grouping them helps. Identity: who produced the data and what the release is called. Measurement: what is being measured, which population and denominator sit behind it, and which period it covers. Location: where the original can be opened. The denominator and the dataset version are the two provenance fields style guides most often leave out, yet they decide whether a percentage can be checked at all.
Style sits on top of that list. APA treats a chart as a figure, the same category as graphs, maps, plots and photographs, so a chart follows figure rules rather than table rules. The Purdue Online Writing Lab guide to APA tables and figures notes that every figure should be understandable on its own and also referred to fully in the surrounding text, which is why the caption has to carry the meaning and the credit together.
The Office for National Statistics chart-text guidance sets out the chain a defensible citation follows:
- Label the visual as a figure where the publication style requires it.
- Write a title that states the principal trend or finding rather than a label such as "Sales by region".
- Put the statistical measure, the geographic coverage and the complete time period in the subtitle or caption.
- Identify the original data publication and the organisation that produced it.
- Keep the source URL, the access or publication date, the dataset version, the table identifier, and any transformation you applied.
Applied to a real chart, that chain reads like this. Subtitle: Share of employees working mainly from home, United Kingdom, 2019 to 2024. Source line: Source: Office for National Statistics, labour market release, 2024.
Practical rule: naming the organisation is the beginning of a citation, not the end of one. The release title, table identifier and reference period are what let a reader find the number again.
One provenance wrinkle remains: when a figure reached you through an aggregator, credit travels with the data. Statlyst figures may be quoted, charted and republished with a link to the Statlyst page, and the original publisher listed with each figure must be credited as well. The ONS guidance makes the same point from the other direction: citing only the webpage that hosts a chart hides the underlying dataset, muddles a publisher with a republisher, and makes later revisions impossible to audit. Full dates in the chart metadata close that gap.
How to Cite a Chart Step by Step
The order matters, because each step records something the next one needs.
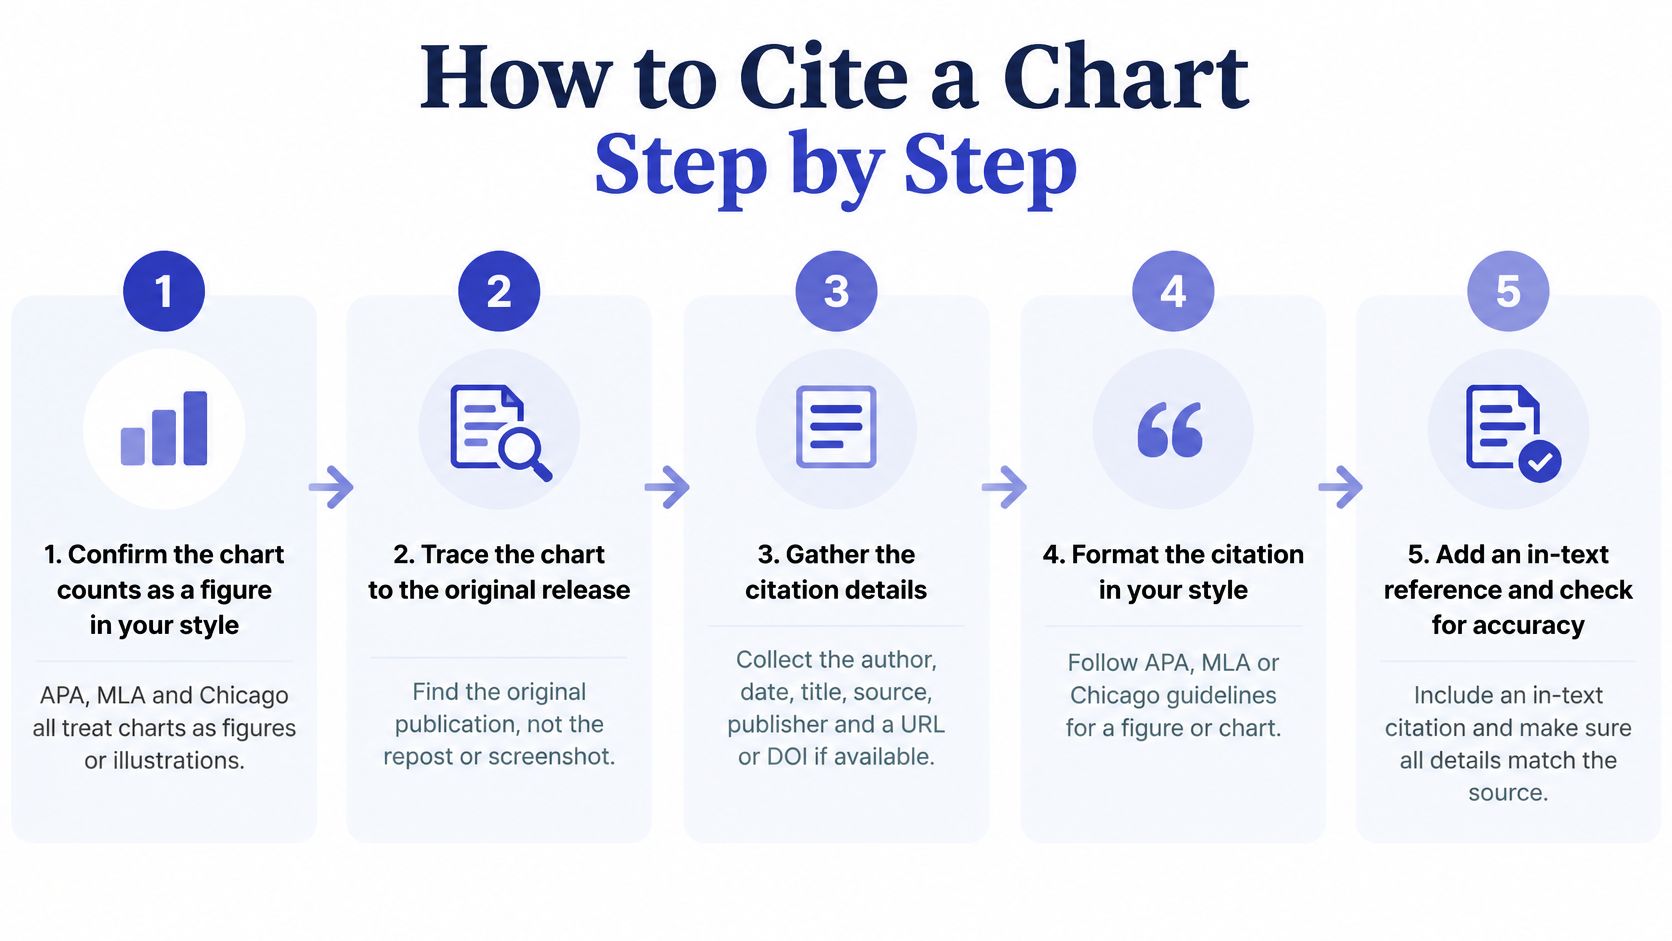
Confirm the chart counts as a figure. APA, MLA and Chicago all place charts in the figure or illustration category rather than the table category. Chicago numbers tables and figures separately and asks for the figure to sit after the paragraph where it is first described, according to the Purdue guide to Chicago formatting. The common slip is treating a chart like a table and losing the figure number.
Trace the chart to the original release. Screenshots, reposts and news write-ups strip out the reference period and sometimes the producer. The slip here is citing the article that reprinted the chart instead of the release that published the data.
Copy the measure, geography, population, reference period, denominator and units. Read them off the chart subtitle first, then off the source table. Skipping the denominator is the slip that turns a percentage into a mystery.
Write the figure label and a finding title. A title such as Remote work share falls fastest among mid-sized employers, 2019 to 2024 tells a reader what the chart argues. A title of "Chart 1" tells them nothing.
Add the source line directly beneath the chart. In APA that's a Note line, in MLA a Source line, in Chicago a credit line at the bottom. The reason is proximity: attribution beside the visual survives editing, while a mention three paragraphs away often doesn't.
Mark any redrawing or alteration. Use Adapted from when you changed the chart and Data from when you built your own visual from someone's numbers. A changed axis range or a regrouped category belongs in that note.
Add the full reference or bibliography entry. Include a retrieval date for online material where your style asks for one. The credit line under a figure doesn't replace the entry elsewhere in the document.
Save the URL, table identifier and access date in your notes. The chart may be revised after publication, and a saved trail lets you defend or correct the number months later.
A five-step version of the same routine is worth keeping on screen while you draft.
The test of completeness is simple. Hand the citation to a stranger and ask them to find the chart, identify the number and open the original. If any of those three fails, something is missing. For help choosing between a statistical office, a research institute and a company release, the guide to official statistics sources sets out which publisher to prefer.
Referencing, Reproducing or Redrawing a Chart
Two questions get merged constantly. One is which work to cite. The other is whether you need permission at all. Separate them and the caption almost writes itself.
Referencing means discussing a chart that stays in its original publication; your document mentions it and links out. Reproducing means the chart itself appears in your document. The IEEE-style guidance from the Purdue guide to tables, figures and equations reaches the core conclusion shared across styles: an outside source must be cited when a table, figure or equation is introduced into your work.
Redrawing is the third case, and the one many people get wrong. Rebuilding a chart in Excel or Flourish from published numbers changes the design, not the ownership of the data. Cite the dataset or the producer that supplied the numbers, label the line Data from, and state which design choices you made, such as axis range, chart type or category grouping.
Practical rule: a new font and a new colour scheme are not a citation. If the bars, the categories and the finding come from someone else's analysis, the note has to say so.
Permission sits off to the side of all this. Georgetown University's publishing guidance on images and copyright notes that publishers differ on permissions and that charts can be protected where their presentation is original enough. Data may be free to reuse while the creative selection and arrangement are not. Editing a third-party figure doesn't remove that question, and some publishers will ask for written permission even when a licence looks permissive.
Statlyst's own terms take a simpler line for its figures: readers may quote, chart and republish Statlyst figures with a link to the Statlyst page, and when the data is reused the original publisher listed with each figure must also be credited. That double credit rule is the model worth copying, because it preserves the chain from aggregator back to source.
| Case | In-text citation | Source line beneath the visual | Reference list |
|---|---|---|---|
| Discussing a chart you did not copy | Cite the larger work where the chart appeared | Not required, because the chart is not in your document | Entry for the larger work |
| Reproducing the chart as published | Standard in-text citation | Reproduced from, with the original publisher and year | Entry for the original work |
| Adapting the chart with changes | Standard in-text citation | Adapted from, with a note on what changed | Entry for the original work |
| Redrawing from the published data | Cite the dataset or producer of the numbers | Data from the producer, with a note on design changes | Entry for the dataset or release |
Chart Citation Formats in APA, MLA and Chicago
The three styles agree on what to record and disagree on where to put it. Once you see the pattern, the differences are small enough to memorise.
| Style | Label and title | Source note | Reference or bibliography entry |
|---|---|---|---|
| APA 7 | Figure 1 in bold, title in italics on the line below | Note. Data from the publisher and year, with Adapted from if altered | Full reference list entry with the URL |
| MLA 9 | Fig. 1 with a title and caption | Source: bibliographic note below the title | Not repeated in Works Cited when the note is complete |
| Chicago 17 | Figure 3, caption directly after the number | Credit line at the bottom, such as Data adapted from | Full note in the notes section and an entry in the bibliography |
APA. Number the figure in bold, put an italic title on the next line, place the chart, then write a Note line naming the source and year, with Adapted from if you changed anything. Add the full reference entry with the URL at the end. That entry belongs to the release that produced the chart: name the organisation that published it and give the publication year of that release, so the reference identifies the producer's original publication rather than the page where you found the chart.
MLA. The Purdue guide to MLA tables and figures explains that MLA places source information below the title, introduced by Source and written in note form, and that the same details need not reappear in Works Cited when the note is complete. That makes the note under the chart the main location for identifying the original work, so it needs full bibliographic detail, not an author name and a bare link.
Chicago. Number the figure, place it after the paragraph where it is first mentioned, put the caption straight after the number, and add a credit line at the bottom. Chicago still expects the source in the notes and bibliography, so the credit line supplements rather than replaces the full documentation.
One rule crosses all three. Refer to the chart by its number, as in Figure 1 or Fig. 1, never as "the chart below", because layout shifts during typesetting. APA cites the producer and year in parentheses alongside the figure number, MLA relies on the Arabic figure number with the producer named in the source note, and Chicago pairs the figure number with full documentation in the notes.
Whichever style you use, the caption or note is also the place for the provenance details the style guides leave implicit: the denominator behind a percentage, the reference period, the population surveyed and the dataset version. A reader checking your number needs those to open the right table in the right release. For the wider mechanics of citing the underlying release, the guide to citing statistics covers authors, dates and retrieval details beyond the figure itself.
Mistakes, Checks and the Fix or Drop Decision
The costliest error is the one that looks tidy: a chart credited to whatever page it happened to be found on. That line points to a republisher, not a producer, and it leaves a reader without a release date or a table to open. Trace the number to the release and cite that.
| Mistake | Why it fails | Fix |
|---|---|---|
| Citing only the website that hosts the chart | Hides the producer, dataset and release date | Trace the number to the original release and cite that |
| Leaving out the period or population | The reader cannot tell which year or group the number describes | Copy the measure, geography and period into the caption or note |
| Matching the chart precision to a rounded source | Shows decimals the source does not support | Match the decimals in the source table and note any sampling error |
| Citing a redrawn chart with no changes listed | Hides truncated axes, dual axes or altered categories | Add Adapted from and state what changed |
| No text alternative for the chart | Screen reader users cannot reach the finding | Add a one-sentence summary or the data table beneath the chart |
Precision deserves its own warning. The ONS data visualisation principles ask for charts to show only the data needed to communicate the trend while supplying context through titles, subtitles, annotations and footnotes. A bar labelled 37.4% is indefensible when the source rounds to whole percentages or carries substantial sampling error. Compare plotted values against the source table, check for breaks in series, and record whether the figure is a count, a percentage, a rate, an estimate or a modelled value.
Accessibility gets skipped more than any other item. Oxford University Press guidance for authors on reproducing copyrighted material treats the credit line and the accessibility requirement as separate jobs, which is why a Source line alone doesn't make a chart usable. Alt text and a data table serve a different reader than the reference entry does.
Run this review before the chart goes into a draft:
- The figure number in the text matches the chart on the page.
- The source line names the publisher and the dataset or release.
- The data year, reference period and population appear in the caption or note.
- The reference entry follows your chosen style and includes a URL where required.
- Online material carries an access or retrieval date.
- Reproduced or adapted charts carry the right label, and reuse terms have been checked.
The review takes about two minutes. The 7-minute guide How to Cite a Statistic Correctly: Source, Year, Sample, Link covers the parts of a citation that sit behind the chart, and the guide to reading a survey statistic helps with the denominator question that trips up so many percentages.
Then decide. Fix anything missing before publication. If the number cannot be traced to a primary source at all, drop the chart and use a figure you can defend.
Before the next chart goes into a draft, open the release it came from and check the five facts one more time. Statlyst's dataset pages carry a ready-made citation for each figure, so the producer, release title and data year are already assembled when you start, and every figure links back to the statistical office, survey team or company that produced it. If the chart you've built doesn't match the source sentence behind it, send the dataset, the figure number and a link to the source that shows the correct value to editorial@statlyst.com and it will be checked.
Questions or corrections: editorial@statlyst.com