Guide · General
How Much Is the Video Game Industry Worth in 2026?
How much is the video game industry worth? Estimates range from US$182.7 billion to US$227 billion, depending on source, year and scope.
By the Statlyst data desk · Updated November 10, 2026 · 11 min read
The video game industry is worth between US$182.7 billion and US$227 billion a year on the main published global estimates for 2023 and 2024, and both numbers hold up. The gap comes from the questions behind them: different publishers, different years and different definitions of what counts as gaming revenue.
Put the sector next to older media and the scale becomes concrete. UNCTAD's 2024 creative-economy analysis, citing PwC's Global Entertainment and Media Outlook, reports that video games reached a scale exceeding the combined revenues of the global film and recorded-music industries, and that the market rose from an estimated US$213 billion in 2022 to US$227 billion in 2023, about 6.6 percent in a year (UNCTAD).
That comparison is why a games figure now turns up in film reports, advertising decks and economic-development filings. It also explains why so many citations go wrong: a software-only number gets quoted as an industry total, or a forecast gets quoted as revenue already banked. A quotable figure is four facts stapled together: the number, the publisher, the year and the scope. Strip any one of them away and the number stops meaning what it appears to mean.
Table of Contents
- Global Revenue Estimates at a Glance
- What the Figure Measures
- How the Market Splits by Platform
- National Figures for the United States and China
- Why Estimates for the Same Year Differ
- Choose the Right Figure for Your Question
Global Revenue Estimates at a Glance
The published estimates cluster into two bands, and the band a figure falls into explains more about it than the figure does. The table lists each headline number with its year, its scope and whether it is reported revenue, a revision or a forecast.
| Source | Year | Scope | Status | Value |
|---|---|---|---|---|
| PwC, cited by UNCTAD | 2023 | Global video game revenue | Estimate | US$227 billion |
| Newzoo, revised estimate | 2024 | Global games market, all platforms | Revised estimate | US$182.7 billion |
| PwC Global Entertainment and Media Outlook | 2024 | Global video games segment | Estimate | US$223.8 billion |
| Newzoo, earlier 2024 estimate | 2024 | Game software only, excluding hardware, peripherals, advertising and gambling | Earlier estimate, not comparable with the revised total | US$184.3 billion |
| Newzoo, earlier forecast | 2025 | Global games market, all platforms | Forecast | US$188.8 billion |
| Newzoo | 2025 | Global games market | Reported figure | US$201.6 billion |
The chart below sets the range against the figures that anchor it.
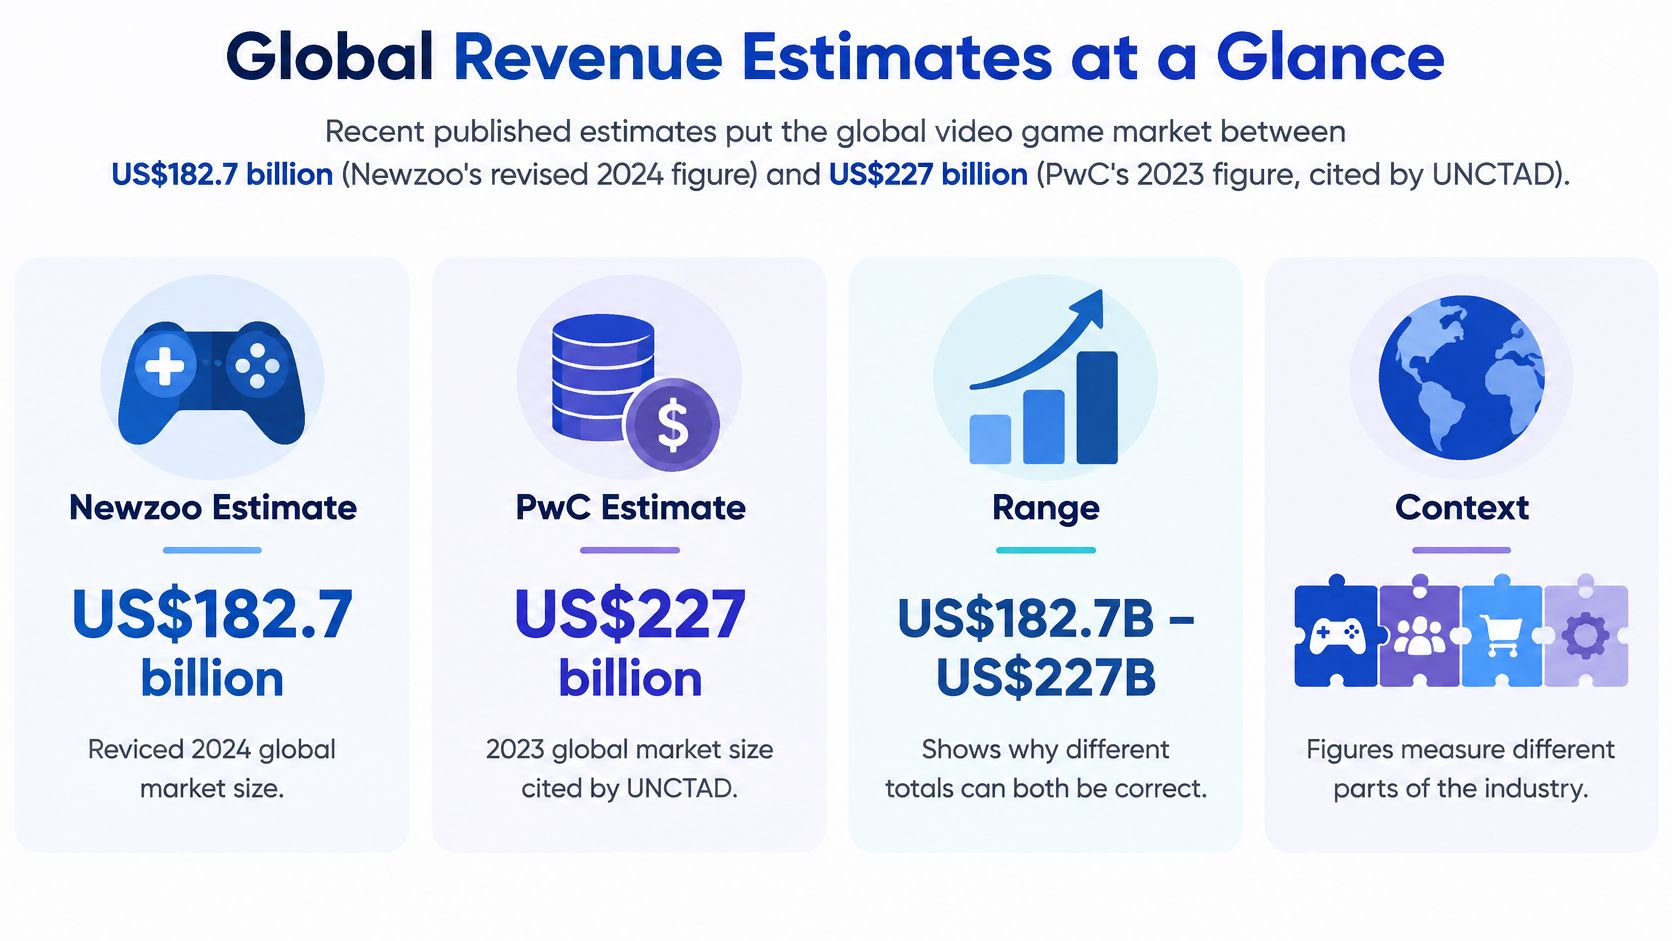
Three differences account for most of the spread. The rows cover different years, from 2023 through 2025. Some report revenue already recorded while others are forecasts written before the year closed. And the perimeter varies: one row counts only game software and excludes hardware, peripherals, advertising and gambling-related game revenue, while the PwC rows sit inside a broader entertainment-and-media segment.
Direction of travel isn't in dispute. PwC values the 2024 video games segment at US$223.8 billion and projects the market approaching US$300 billion by 2029, a compound annual growth rate of about 5.7 percent (PwC). Newzoo's own count for 2025 came in at US$201.6 billion for the global games market (Game World Observer).
Ranking rows against each other is where errors creep in. The software-only estimate measures a narrower slice than the revised all-platform total, so ordering the two by size tells you nothing.
Quotable figure: for one global number, use Newzoo's revised US$182.7 billion for the 2024 games market across mobile, console and PC, and state the year and scope in the same sentence. PwC's US$227 billion covers 2023 and a broader segment, so it travels with those labels attached.
What the Figure Measures
A single shop reports sales, profit and its effect on the local economy as three different numbers. Nobody calls that a contradiction, because each one answers a different question. The games industry works the same way, and most arguments about how much is the video game industry worth are really arguments about which question is on the table.

Four Measures That Produce Four Numbers
- Software revenue counts money spent on the games themselves, digital and physical. Newzoo's 2024 estimate put worldwide game software at US$184.3 billion, of which US$175.8 billion, or 95.4 percent, was digital and about US$8.5 billion, or 4.6 percent, physical. Console, PC and mobile hardware, accessories and some advertising income were excluded from that count (TweakTown).
- Consumer spending counts what players pay at the point of sale for full games, downloadable content, microtransactions and subscriptions.
- Contribution to GDP counts the value companies add after subtracting the inputs they buy, which is a smaller number than sales and a different claim entirely.
- Total economic impact adds the wider effects: supplier activity, supported jobs and the spending those wages generate.
Hardware and accessories are the biggest swing item. A console launch pushes devices into the count; a dry year between generations takes them out again. Advertising, esports and adjacent services such as cloud streaming sit inside or outside a total depending on the analyst's perimeter, and a figure built on recurring in-game spending behaves nothing like one built on boxed sales.
Status matters as much as scope. Reported revenue, a revised estimate and a forecast are three different claims, and only the first describes money that has changed hands. The same discipline is useful anywhere entertainment figures get compared, including video streaming statistics, where a household count and a revenue total stop being interchangeable once either loses its year.
How the Market Splits by Platform
Newzoo's 2025 forecast put the global games market at US$188.8 billion, up 3.4 percent year on year, split across three platforms with very different economics (Newzoo).
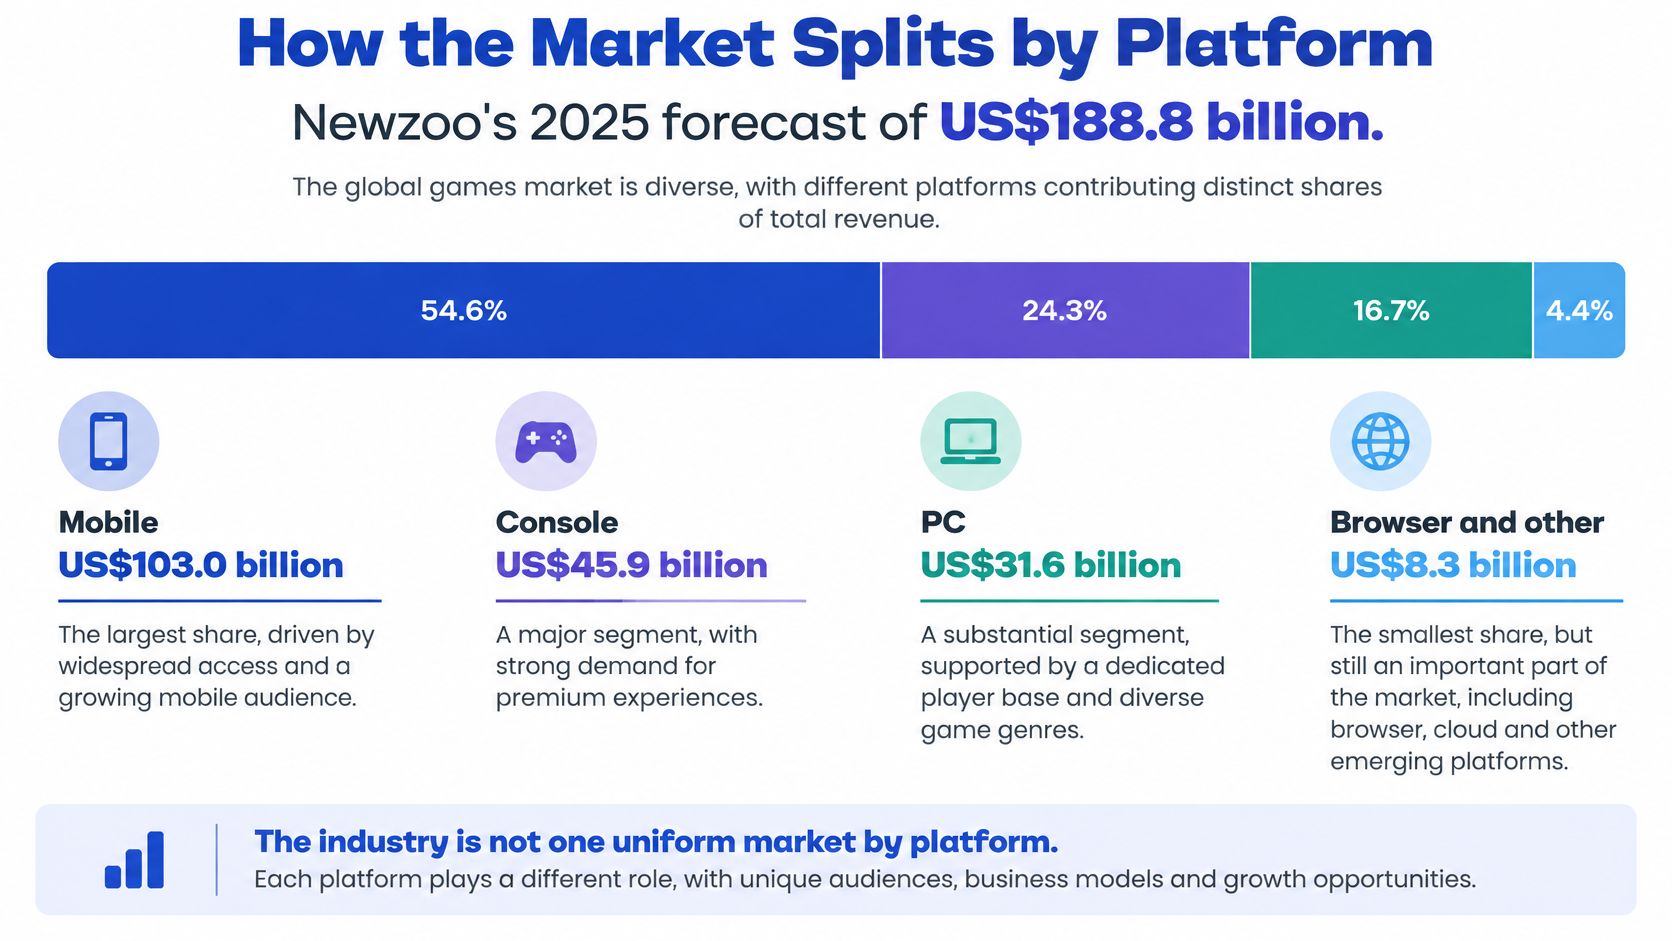
| Platform | 2025 forecast revenue | Projected growth | Main revenue model |
|---|---|---|---|
| Mobile | US$103.0 billion | Not published separately | Free-to-play, advertising and microtransactions |
| Console | US$45.9 billion | 5.5% | Premium releases and subscriptions |
| PC | US$39.9 billion | Not published separately | Premium releases and subscriptions |
| Total | US$188.8 billion | 3.4% | Sum of the three platforms |
Why Mobile Carries More Than Half
Mobile at US$103.0 billion isn't a story about higher prices per game. It's a story about free-to-play distribution, enormous installed bases, persistent live operations, advertising and microtransactions. Revenue per player grows through retention and conversion funnels rather than through a higher sticker price, which is why mobile totals climb even when the number of new players barely moves.
Console revenue behaves differently. At US$45.9 billion it was expected to grow 5.5 percent, faster than the market as a whole, and its calendar is set by premium release schedules, hardware cycles and subscription economics. A strong software slate lifts the year; the gap between consoles deflates it. PC, at US$39.9 billion, follows a similar rhythm with a longer tail, since storefront catalogues keep selling years after launch.
Mobile sets the total. A figure of roughly US$189 billion is, more than half of it, a story about free-to-play retention rather than about game launches.
The practical consequence is that a total is mostly a mobile number. Strip mobile out and the same industry grows at a different rate on a different calendar, so a console-only or PC-only forecast describes a different business from the headline. China's national figures show the pattern again at country scale. Mobile's lead also means phone adoption is the leading indicator for the whole market, which is why smartphone usage statistics sit behind the installed base that platforms sell into.
When a platform figure arrives, check two things before quoting it: whether it's a forecast or recorded revenue, and whether all three platforms are inside the total.
National Figures for the United States and China
National figures answer a narrower question with more precision, and the two biggest markets publish them in different currencies and on different definitions.
| Market | Year | Measure | Value |
|---|---|---|---|
| United States | 2023 | Consumer spending, all platforms | US$59.3 billion |
| United States | 2024 | Consumer spending, all platforms, January 2025 release | US$58.7 billion |
| United States | 2023 | Contribution to GDP | Nearly US$66 billion |
| United States | 2023 | Total economic impact | More than US$101 billion |
| China | 2024 | Actual sales revenue | RMB 325.78 billion, up 7.5% |
| China | 2024 | Mobile games revenue | RMB 238.22 billion, up 5.0% |
Reading the US Figures Without Mixing Them
The Entertainment Software Association's 2024 Essential Facts report measures US consumer spending at US$59.3 billion for 2023, covering physical and digital full games, downloadable content and microtransactions, subscriptions, and game activity on console, cloud, mobile, portable, PC and virtual-reality platforms. The same report puts the industry's contribution to US GDP at nearly US$66 billion and its total economic impact above US$101 billion (ESA).
Those three numbers measure demand, value added and wider activity. Quoting the GDP figure as market size is the most common error in this area, and it flatters or deflates a story depending on which way the writer needs it to lean.
The January 2025 release from the ESA, Circana and Sensor Tower reported US$58.7 billion of 2024 consumer spending, down from the prior year, with content at US$50.6 billion, hardware at US$4.9 billion and accessories at US$3.2 billion (ESA). Mobile games accounted for roughly US$26 billion of content spending before app-store fees, about half the content total.
The two consumer-spending rows in the table are consecutive years, not two versions of one number. Read together they show a decline of roughly US$600 million from 2023 to 2024, and the breakdown explains where it sat: content did the heavy lifting at over five times the hardware and accessories lines combined, while mobile alone supplied about half of that content figure.
Match the year before quoting the number. US$59.3 billion is 2023 spending and US$58.7 billion is 2024 spending. Swapping them turns a small decline into apparent growth.
China's numbers arrive in renminbi and shouldn't be converted without stating the exchange-rate date and method. The 2024 China Gaming Industry Report records RMB 325.78 billion in actual sales revenue, up 7.5 percent, with mobile games at RMB 238.22 billion, up 5.0 percent, roughly three quarters of the domestic market (Game Publishers Association Publications Committee and China Game Industry Research Institute).
The Chinese measure is also a different measure. "Actual sales revenue" counts what the industry sold, where the US consumer-spending line counts what players paid, hardware and accessories included. An American consumer-spending total, an American GDP contribution and a Chinese sales-revenue figure are three answers to three different questions, and none of them answers the global one.
Why Estimates for the Same Year Differ
Newzoo's own numbers make the case. Its earlier 2024 forecasts were US$189.3 billion and US$187.7 billion; the revised figure landed at US$182.7 billion, up 3.2 percent on 2023 but below both projections (Newzoo). Nothing went badly wrong there. Forecasts are written before the year closes, and revisions follow the data in.
Timing, Scope and Currency
Timing explains most of it. Newzoo's subsequent outlook placed 2025 revenue near US$188.9 billion, a separate Newzoo report projected US$188.8 billion for the same year and counted 3.6 billion players worldwide, and a later figure for 2025 came in higher still. Two forecasts and one recorded total for a single year can all be published by the same organisation. Before comparing them, check the publication date and whether the number is a projection.
Scope explains the rest. A software-only estimate for 2024 that excludes hardware, peripherals and advertising sits higher than the revised all-platform total, which points to different editions or perimeters rather than to one being wrong. PwC's broader video games segment is higher again, because it counts categories that a games-only taxonomy leaves out.
Currency matters whenever a national market enters a global comparison. China's revenue is published in renminbi, and any dollar figure derived from it needs the exchange rate and the date it was struck.
The forward projections follow the same logic. Newzoo's outlook put 2026 at approximately US$196.2 billion and 2027 at US$201.4 billion, a measured pace rather than the pandemic surge.
Rule of thumb: when two totals for the same year differ by more than ten percent, check the publication date first, then the scope, then the currency. Volume of coverage is the last thing to check.
The same checks apply to any sample-based number. Statlyst's guide to how to read a survey statistic sets out the questions worth asking before quoting a percentage or a total. On Newzoo's revised basis, the industry was worth about US$182.7 billion in 2024. Broader definitions put it higher, and both statements survive.
Choose the Right Figure for Your Question
The checklist below runs in about two minutes and prevents most of the errors described above.
- Name the question. Global market size, software only, US consumer spending, US economic footprint, or a single national market. Each has one right answer and several wrong ones.
- Match the figure to it. Newzoo's revised all-platform total suits a global market-size claim. The Entertainment Software Association's consumer-spending figure suits a US demand claim. Neither substitutes for the other.
- Confirm the year and the status. A 2024 total, a 2025 forecast and a 2029 projection are different instruments. Say which one is in the sentence.
- Write the scope into the sentence itself. Software only or all platforms, the country, the currency, and whether hardware, advertising or gambling revenue is included.
- Trace the number to the publisher named in the release. Newzoo, PwC, the Entertainment Software Association or the Game Publishers Association Publications Committee, and copy the measure wording exactly. Consumer spending is not market size, and contribution to GDP is not industry revenue.
- For any global claim, cite at least two sources and state the gap. If the piece relies on a single figure, say which organisation produced it and why that definition fits the question.
Statlyst's guides on reading, checking and citing statistics cover the same ground in more detail, including how to record the source sentence alongside the number so a later edit can't change the meaning.
The next time a headline needs a number, start with the primary release rather than the summary of it: Newzoo's market report for a global total, PwC's outlook for the broad entertainment segment, the ESA's Essential Facts for US spending, or the China Gaming Industry Report for renminbi revenue. Statlyst's library at statlyst.com keeps each figure beside the sentence it came from, its publisher, its data year and a link to the source document, which turns a fact-check into a lookup rather than a rebuild. Pick the one figure the piece depends on, write its year and scope into the sentence, and the rest of the numbers get easier.
Questions or corrections: editorial@statlyst.com