Guide · General
How Many People Are Uninsured in the US in 2025
How many people are uninsured in the US? The Census counts 26.7 million for 2025 (7.9%), and other surveys report different totals by method.
By the Statlyst data desk · Updated November 5, 2026 · 14 min read
In 2025, 26.7 million people, or 7.9% of the US population, were uninsured for the entire calendar year, according to the US Census Bureau's report on Health Insurance Coverage in the United States, based on the Current Population Survey Annual Social and Economic Supplement covering people of all ages.
That full-year definition is the strictest common yardstick, because a person who lost coverage for part of the year and later regained it doesn't appear in the 26.7 million. Other federal surveys answer different questions. One asks about coverage on the interview date, which catches people in the middle of a gap the calendar-year count misses. Another is built to support state and local comparisons. Different totals follow, and each is accurate for the question it was designed to answer.
A reader asking how many people are uninsured in the US therefore needs five elements in the same sentence: the count, the rate, the period, the population and the publisher. Drop one, and two accurate numbers can look contradictory when they measure different things.
Table of Contents
- The Current Count of Uninsured Americans
- Why Surveys Report Different Totals
- How the Uninsured Rate Has Moved Since 2023
- Which Groups Make Up the Uninsured
- Why People Fall Through Coverage Gaps
- Quote and Verify Each Uninsured Figure
The Current Count of Uninsured Americans
The simplest answer uses the latest full-year national measure. The US Census Bureau publication page for Health Insurance Coverage in the United States 2025 reports that 26.7 million people, or 7.9% of the US population, were uninsured for the entire calendar year in 2025, and describes the rate as statistically unchanged from 2024. The same publication page states that 92.1% of people had coverage at some point during 2025, so the uninsured count excludes people who were covered for part of that year.
That boundary explains why the full-year count shouldn't be treated as a count of everyone who experienced any gap. A person covered from January through October and uninsured afterward was insured for part of the year under this measure. A person with no qualifying coverage in any month belongs in the full-year uninsured total.
The Counts Side by Side
| Measure | Data year | Uninsured people | Uninsured rate | Scope |
|---|---|---|---|---|
| Census CPS ASEC, full calendar year | 2025 | 26.7 million | 7.9% | All ages, uninsured for the entire year |
| Census CPS ASEC, full calendar year | 2024 | 27.0 million (full report; press release says 27.1 million) | 8.0% | All ages, uninsured for the entire year |
| Census American Community Survey | 2024 | About 27 million | 8.2% | All ages, used for state and local comparisons |
| CDC National Health Interview Survey, point-in-time | 2024 | 27.2 million | 8.2% | All ages, civilian noninstitutionalized, uninsured at interview |
| CDC National Health Interview Survey, working-age | 2024 | 23.1 million | 11.6% | Adults ages 18 to 64, uninsured at interview |
For 2024, Health Insurance Coverage in the United States 2024 states that 8.0 percent of people in the United States, or 27.0 million people, were uninsured for the entire 2024 calendar year. A separate Census Bureau press release on income, poverty and health insurance coverage gives approximately 27.1 million people, or 8.0% of the population, uninsured for the entire calendar year in 2024. This article quotes 27.0 million from the full report and identifies the press-release figure where the difference matters.
The other 2024 rows answer related but distinct questions. The Census Bureau American Community Survey brief for 2024 estimates about 27 million Americans, or 8.2% of the population, were uninsured in 2024, using a survey widely used for state and local comparisons. The CDC National Health Interview Survey early release for 2024 estimates 27.2 million US residents of all ages, or 8.2% of the civilian, noninstitutionalized population, were uninsured at the time of interview.
The working-age rate is higher because Medicare covers nearly all older adults in the all-age denominator. The practical rule is direct. Readers who need a full-year national answer should quote the Census CPS ASEC figure. Readers who need coverage status at interview, or a state comparison, need a different row and a different sentence. The Statlyst guide to official statistics sources sets out how primary publishers should be identified before a figure is reused.
There's no single uninsured number independent of its period, population and definition.
Why Surveys Report Different Totals
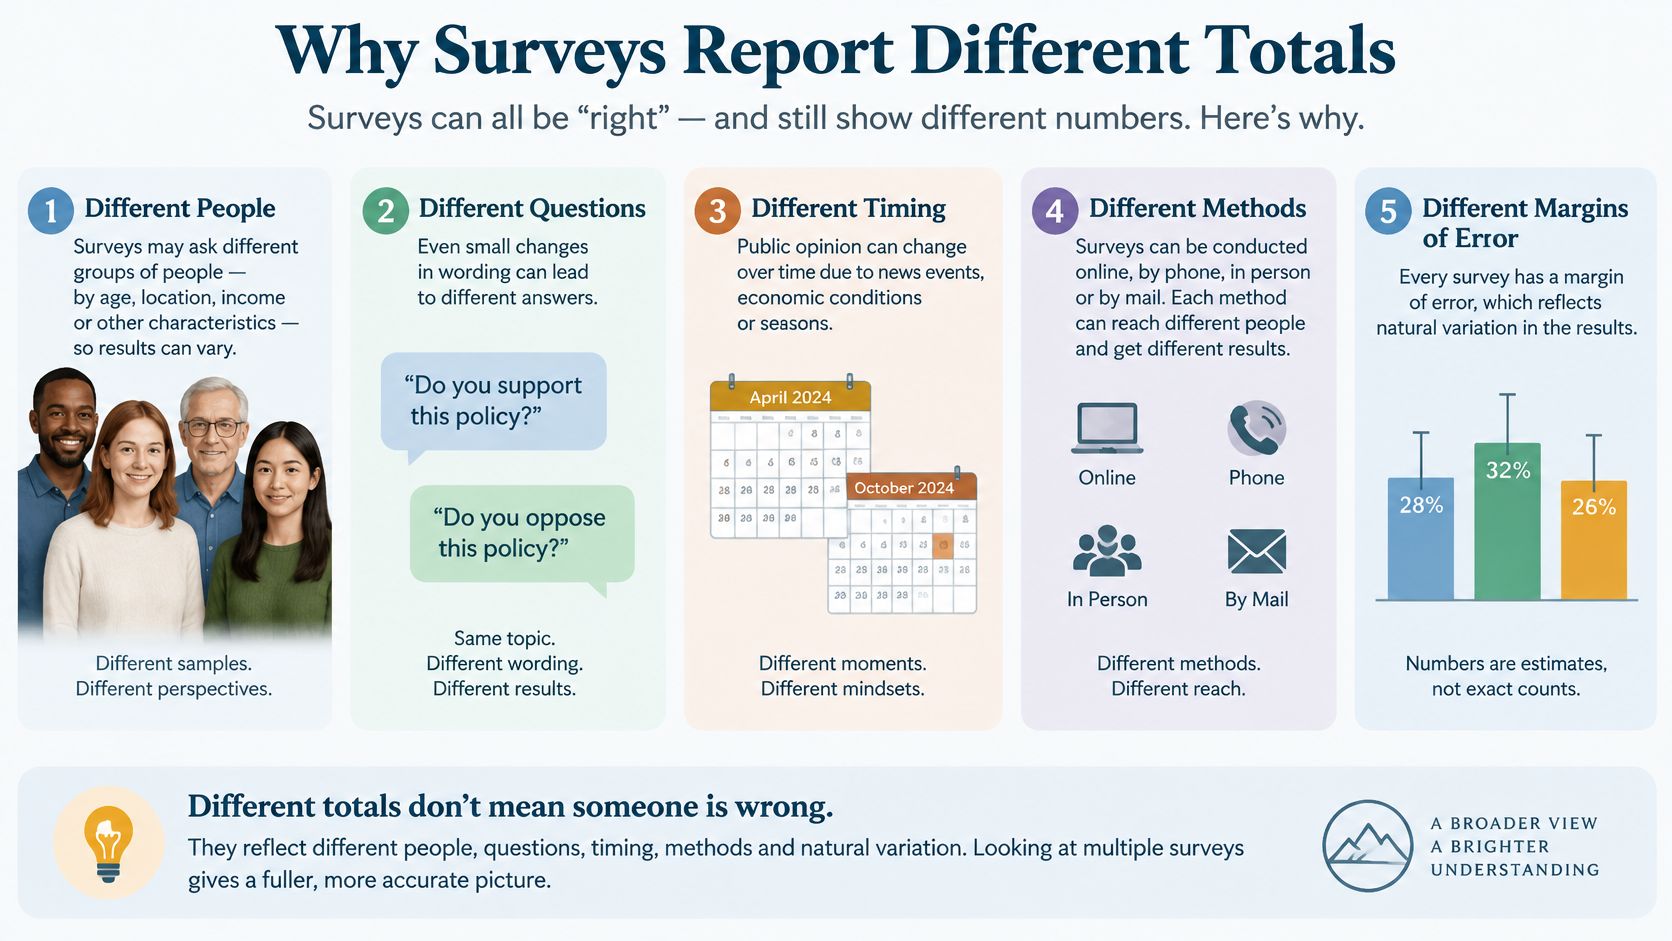
A head count at a stadium gate on one evening doesn't measure the same attendance as a count of everyone who entered during a season. Health insurance surveys work the same way. A full-year measure asks whether a person lacked coverage for an entire calendar year, while a point-in-time measure asks whether the person lacked coverage when interviewed. Someone uninsured in March and covered again in June can appear in a point-in-time snapshot taken in March, but that person isn't a full-year uninsured person.
Timing Explains Much of the Gap
The HHS ASPE report on coverage, affordability and access from 2021 to 2024 reported an uninsured rate of 7.6 percent for the United States in the second quarter of 2024, using the National Health Interview Survey. The same report gives 8.5 percent in March 2024 from the Census Bureau's Current Population Survey and 8.2 percent for January through March 2024 from the NHIS. Those estimates sit alongside the Census full-year estimate of 8.0% for 2024, but they don't share the same reference period.
ASPE's explanation is methodological rather than political. The CPS annual estimate examines coverage during the prior calendar year, while NHIS estimates measure whether respondents were uninsured at interview or during a specified quarter. Different windows capture different people, especially people whose coverage changes after a job move, a Medicaid renewal or another transition.
Age scope adds another layer. For non-elderly Americans, that ASPE report estimated 10.1 percent, or 27.7 million people, were uninsured in March 2024 using the CPS. Its NHIS estimate for non-elderly people in the first quarter of 2024 was 9.8 percent, with a 95 percent confidence interval of 9.0 percent to 10.8 percent. The non-elderly rates exceed all-age rates because most older adults have Medicare, which lowers the all-age result.
A rate is comparable only with another rate that shares its period, population and definition.
Three checks prevent most reporting errors:
- Reference period: Full calendar year, interview date and named quarter aren't interchangeable.
- Age range: All ages, non-elderly people and adults of working age produce different denominators.
- Coverage gap rule: A short gap can count in a snapshot while remaining outside a full-year total.
The Statlyst guide on how to read a survey statistic applies the same checks to confidence intervals and sample populations. Applied consistently, those checks turn an apparent disagreement into a set of answers to different questions.
How the Uninsured Rate Has Moved Since 2023
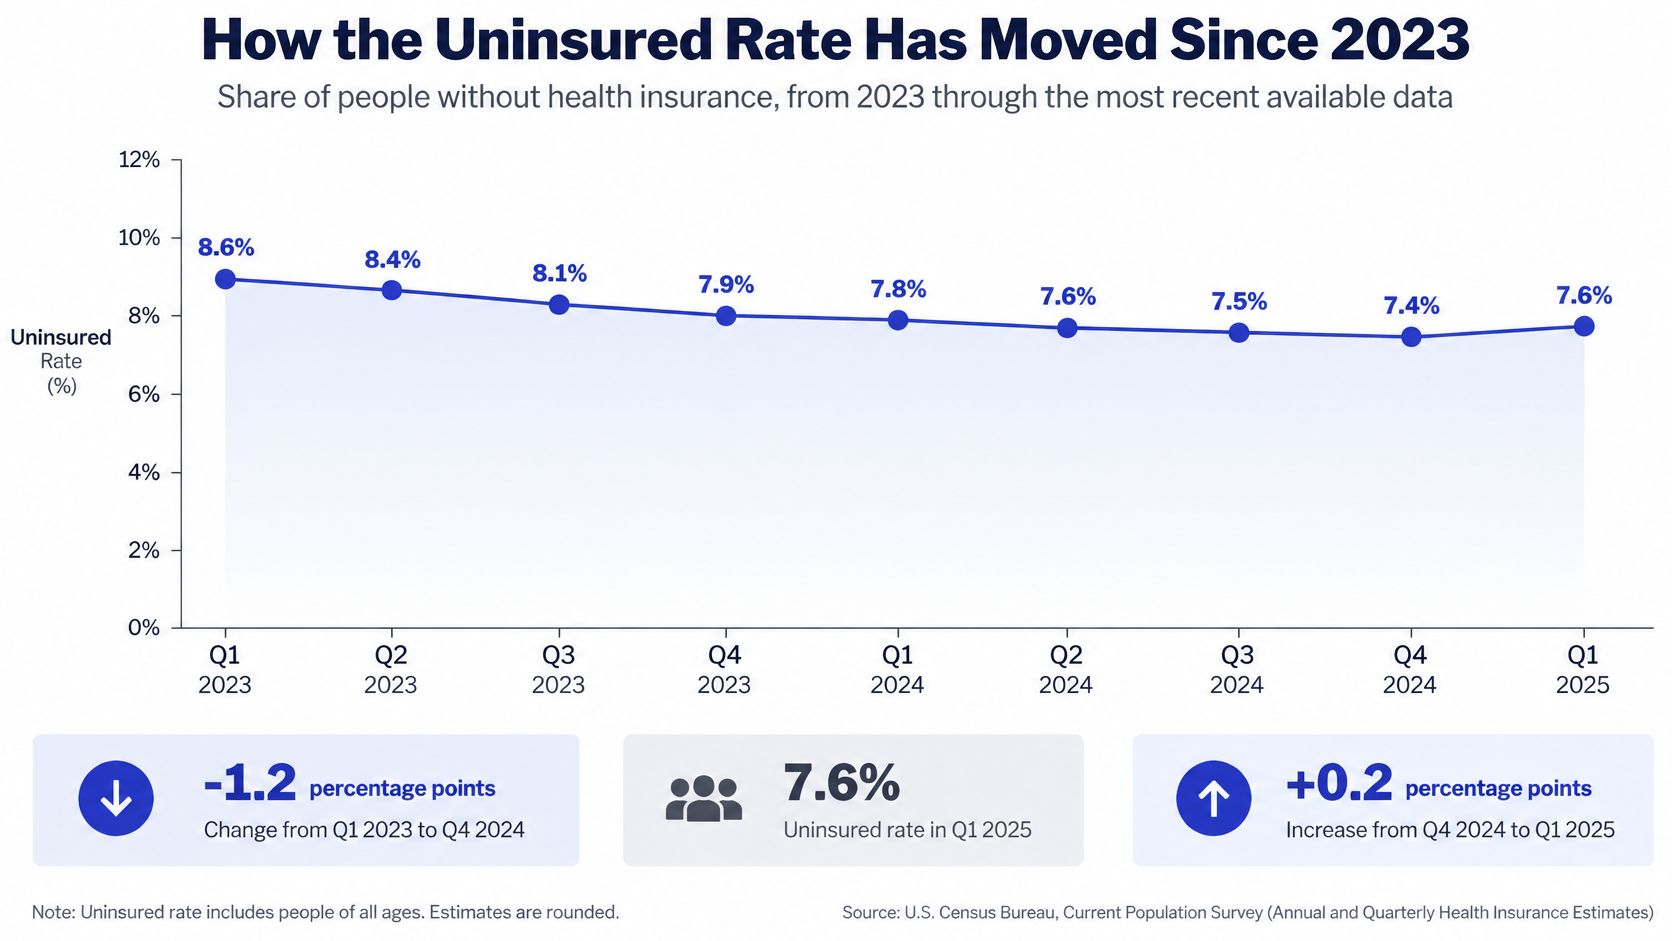
The Census full-year rate held at 8.0% in 2023 and 8.0% in 2024, then edged down to 7.9% in 2025. That is a flat line at the all-age level, and a one-tenth-point change can sit inside normal survey uncertainty, which is why the Census Bureau's own significance testing matters before anyone calls the movement a trend.
Trend by Source
| Measure | 2024 | 2025 | Note |
|---|---|---|---|
| Census CPS ASEC, full calendar year rate | 8.0% | 7.9% | All ages, uninsured for the entire year |
| Census American Community Survey rate | 8.2% | No 2025 figure quoted | Rose rather than declined for the first time in its recent series |
| CDC National Health Interview Survey, point-in-time count | 27.2 million (8.2%) | No 2025 figure quoted | Change classified by the CDC as not statistically significant |
| Census CPS ASEC, adults ages 19 to 64 rate | No figure quoted | 11.0% | Working-age adults, full calendar year |
Three series, three different readings of the same period. The Census full-year line stayed flat. The American Community Survey moved the other way in 2024, recording the first recent year in which its national rate rose rather than declined. The NHIS point-in-time count also moved higher between 2023 and 2024, but the CDC classified that change as not statistically significant, so it can't be cited as conclusive evidence that coverage deteriorated.
Stability at the Top, Movement Underneath
A flat all-age rate can hide pressure in the working-age population. The Census Bureau report on health insurance coverage in 2025 reports that 11.0% of adults ages 19 to 64 were uninsured in 2025, compared with 5.8% of children under 19, and that public coverage for working-age adults fell by 0.5 percentage points in 2025, driven by a 0.6-point decline in Medicaid coverage. An all-age average can hold steady while the coverage mix beneath it shifts, which is exactly what this combination of a stable rate and a falling Medicaid share describes.
Reporting rule: Call a change a trend only when it exceeds survey uncertainty and the source doesn't label it not significant.
None of the three lines needs to be wrong for the others to be right. The Census full-year series shows stability, the ACS shows a rise within its own series, and the NHIS shows a higher point estimate that didn't reach significance. Each answers a slightly different question, so the conclusions coexist.
Which Groups Make Up the Uninsured
The 7.9% all-age rate averages groups with sharply different odds of going a full year without coverage. Medicare reaches nearly all adults ages 65 and over, children often qualify through Medicaid or CHIP, and working-age adults depend on employer plans, Medicaid eligibility or a Marketplace plan. The Census table shows the result: measured risk peaks among young adults and falls steadily with age.
Census rows below are from the Census Bureau report on health insurance coverage in 2025; the CDC row is sourced in the paragraph that follows it.
| Group | Data year | Uninsured rate | Scope |
|---|---|---|---|
| All ages | 2025 | 7.9% | Census, full calendar year |
| Children under 19 | 2025 | 5.8% | Census, full calendar year |
| Adults ages 19 to 64 | 2025 | 11.0% | Census, full calendar year |
| Young adults ages 19 to 25 | 2025 | 14.5% | Census, full calendar year |
| Adults ages 45 to 64 | 2025 | 8.6% | Census, full calendar year |
| U.S.-born children under 19 | 2024 | 5.3% | Census, full calendar year |
| Foreign-born children under 19 | 2024 | 19.4% | Census, full calendar year |
| Naturalized citizen children under 19 | 2024 | 10.6% | Census, full calendar year |
| Children ages 0 to 17 | 2024 | 5.1% (3.7 million) | CDC, separate age range and survey |
Age Changes the Denominator
The Census Bureau report on health insurance coverage in 2025 puts children under 19 at a 5.8% uninsured rate and adults ages 19 to 64 at 11.0% under the full-year measure. Young adults ages 19 to 25 reached 14.5%, the highest row in the table, while adults ages 45 to 64 came in at 8.6%. Every Census row shares the same data year, survey and definition, so the spread reflects the age denominator rather than differences in method.
The 19-to-25 peak carries a practical reading. People in that band are leaving school, changing jobs or ageing out of a parent's plan and childhood eligibility rules. The table assigns no cause to any individual, but it locates the transition years where a full-year gap in coverage is most likely to appear.
Citizenship and Birthplace Show a Wider Gap
Among children, birthplace produces a wider spread than the national age split. The Census Bureau report on health insurance coverage in 2024 reported that 5.3 percent of children under age 19 who were born in the United States were uninsured for the full 2024 calendar year, compared with 19.4 percent for foreign-born children under age 19. Within that foreign-born group, children who were naturalized US citizens had a lower rate of 10.6 percent.
The gap between 5.3% and 19.4% is 14.1 percentage points, larger than the distance between the child and all-age national rates. It still shouldn't be read as a claim about immigrant families generally: the rows cover children under 19 in 2024 under a full-year definition, and the naturalized-citizen row shows that legal status divides the foreign-born group itself.
Children appear once more under a separate federal measure. The CDC press release on health insurance coverage estimates for 2024 states that 3.7 million US children ages 0 to 17, or 5.1% of children, were uninsured in 2024. That row uses ages 0 to 17, not under 19, and comes from a different survey, so it belongs in the table as its own line rather than as a substitute for the Census child rate.
A row is quotable only with its year, age range and survey attached. Two child rates, 5.8% and 5.1%, can both be accurate because they measure different populations under different definitions.
Why People Fall Through Coverage Gaps
Coverage works like a building with several doors. A person enters through an employer plan, Medicaid, CHIP, a Marketplace plan, Medicare or another qualifying private or government plan. A person is counted as uninsured only when none of those routes applies under the survey definition. That structure explains why employment, age and programme eligibility shape the total so strongly.
Qualifying Coverage and Edge Cases
The CDC National Health Interview Survey early release covering full-year 2024 defines a person as uninsured when none of the qualifying private or government plans applies, including employment-based coverage, Medicaid, CHIP and Marketplace plans. The same release reports 11.6% of adults ages 18 to 64 were uninsured in 2024, substantially above the all-age rate of 8.2%, because nearly all adults 65 and older are covered through Medicare.
Some limited arrangements do not meet the CDC definition of full health insurance. A person with Indian Health Service coverage alone is classified as uninsured in that release. A plan paying only for one service, such as dental or vision care, also leaves the holder counted as uninsured. Someone can therefore receive a limited service and still lack coverage for hospital care, physician services or prescriptions.
The six-month picture differs. For January to June 2024, the CDC early release covering that survey period reports that 69.4% of adults ages 18 to 64 had private coverage, 21.2% had public coverage and 11.1% were uninsured. Those interim shares describe working-age adults during a six-month window. They should not be combined mechanically with annual population totals or full-year Census rates.
Three Hypothetical Cases
- A worker laid off for three months: The worker loses employer coverage, remains uninsured briefly and regains coverage through a new job. A point-in-time survey during the gap counts the worker as uninsured, while the Census full-year measure does not.
- A 22-year-old without job coverage: The young adult has left a parent's plan and has no employer, Medicaid, CHIP or Marketplace coverage for the whole year. Both a snapshot during that year and the full-year measure count the person as uninsured.
- A 70-year-old on Medicare: The older adult has qualifying coverage and sits outside the working-age denominator. Medicare coverage lowers the all-age uninsured rate without changing the rate for adults under 65.
Job changes, Medicaid disenrollment, and short administrative gaps move people between those categories. Under the Census full-year measure, a person covered at any point during the year stays out of the full-year uninsured count, so that figure intentionally excludes brief interruptions. A rising point-in-time count can therefore signal more churn even while many individuals keep coverage for part of the year. The count rises only when enough people fail to enter through any qualifying door during the measured window.
Quote and Verify Each Uninsured Figure
The decision comes before the number. Writers should first state the question in plain language, then choose the survey designed to answer it. A full-year question needs a full-year survey. A question about coverage on a particular day needs a point-in-time survey. A state or county comparison needs the survey built for smaller geographies.
| Question | Measure to quote | Publisher | Scope to state |
|---|---|---|---|
| How many people were uninsured for all of a year? | Full-year uninsured count and rate | U.S. Census Bureau, Current Population Survey | All ages, full calendar year |
| How many people lacked coverage on a given day or quarter? | Point-in-time uninsured count | CDC, National Health Interview Survey | Civilian noninstitutionalized, at interview |
| How do states and counties compare? | State and local uninsured rates | U.S. Census Bureau, American Community Survey | Survey year and geography named |
| How many children lacked coverage? | Children under 19 full-year rate, or CDC children count | U.S. Census Bureau or CDC | Age range and year named |
| How many working-age adults lacked coverage? | Adults ages 18 to 64 point-in-time rate | CDC, National Health Interview Survey | Ages 18 to 64, at interview |
Match the Measure to the Question
Full-year national counts come from the Census Bureau's Current Population Survey Annual Social and Economic Supplement. Counts at interview or during a quarter come from the CDC's National Health Interview Survey. State and county comparisons come from the Census Bureau's American Community Survey, with the geography and survey year stated in the sentence.
Children require particular care because federal publications don't always use the same age band. Census rows may cover children under 19, while the CDC children count covers ages 0 to 17. Neither label should be shortened to "children" without the age range when the figure is quoted. The same discipline applies to working-age adults, where the relevant band must remain visible.
Correct and Incorrect Sentences
A correct sentence preserves the population and period. "In 2024, 8.0 percent of people in the United States were uninsured for the entire year, according to the Census Bureau's Current Population Survey." That wording identifies the year, rate, national population, full-year period and publisher.
An incorrect version changes the denominator. "In 2024, 8.0 percent of working-age adults were uninsured, according to the Census Bureau." The rate belongs to people of all ages, not working-age adults. Pairing a Census full-year all-age rate with an NHIS working-age rate creates the same error, even when both numbers were copied accurately from their releases.
Accuracy check: Copying the digits correctly isn't enough if the sentence assigns them to the wrong population.
Six Verification Steps
- Confirm the question: Decide whether the story needs a full-year, point-in-time, quarterly or geographic measure.
- Open the primary release: Use the Census health insurance report, CDC NHIS early release or ACS brief rather than a secondary summary.
- Copy the figure exactly: Preserve the decimal, unit and count, including whether the 2024 Census figure is quoted as 27.0 million from the full report.
- Record the scope: Write down the period, population, age range and definition of qualifying coverage.
- Check significance wording: Note whether the publisher calls a change statistically significant, not statistically different or unchanged.
- Write all five elements: Include the figure, data year, publisher, population and period in the published sentence.
The Statlyst guide on how to cite statistics gives the same five elements a durable citation format for articles, reports and classroom work. Editors can apply the checklist before publication by comparing the final sentence against the primary release, not against another article. That final check catches the most common failure in coverage of this topic, which is not an invented number. It's a real number attached to the wrong year, age group or reference period.
For the next sourced statistic, use Statlyst to open the primary release, copy the exact Census or CDC sentence, and record the publisher, data year, age range and reference period before drafting the claim. Build the citation alongside the sentence, then check the publisher's significance wording one final time before publication.
Questions or corrections: editorial@statlyst.com