Guide · General
Browser Market Share 2026: Leaders, Trends and Sources
Browser market share in 2026: Chrome leads at 68.79% worldwide, with Safari second. See how the figures are measured and compared.
By the Statlyst data desk · Updated November 12, 2026 · 11 min read
In October 2026, Google Chrome accounted for 68.79% of measured worldwide browser usage, according to StatCounter's worldwide browser series. Safari sat far behind, and the six named browsers together covered 97.52% of that observed usage. A browser market share number only holds its meaning when the month, the population and the unit travel with it. The same label can describe visits to one set of sites or observations on a much wider measurement network, and those choices move the result by many points. The notes below fix the October 2026 ranking, show why careful sources disagree, and set a rule for picking the figure that matches the question.
Table of Contents
- Worldwide Browser Market Share in October 2026
- Why Browser Share Estimates Disagree and Which Scope to Quote
- Desktop Share Versus Combined Share
- Browser Share Trends From 2024 to 2026
- Choose the Right Browser Share Figure for Your Question
- How to Use Browser Share to Set Test Priorities
Worldwide Browser Market Share in October 2026
In October 2026, Google Chrome held 68.79% of browser market share worldwide, Apple Safari held 16.59%, Microsoft Edge 5.36%, Mozilla Firefox 2.57%, Opera 2.16% and Samsung Internet 2.05%, as reported by StatCounter Global Stats. The six listed browsers together represented 97.52% of worldwide usage in that period, so all other browsers are the remaining 2.48%. The scope is all browser usage worldwide for October 2026. StatCounter identifies the measure as browser market share, not installed software and not survey responses, so the percentages describe observed web usage.
Worldwide browser share, all devices, October 2026
| Browser | Share of worldwide usage | Engine or ecosystem |
|---|---|---|
| Google Chrome | 68.79% | Chromium, Google |
| Apple Safari | 16.59% | WebKit, Apple devices |
| Microsoft Edge | 5.36% | Chromium, Microsoft |
| Mozilla Firefox | 2.57% | Gecko, Mozilla |
| Opera | 2.16% | Chromium, Opera Software |
| Samsung Internet | 2.05% | Chromium, Samsung |
| Six named browsers combined | 97.52% | Mixed |
| All other browsers | 2.48% | Mixed |
What each row is counting
Chrome at 68.79% is the benchmark. Its share was more than four times Safari's, on Google's Chromium platform. Safari at 16.59% is the only other browser above 10%, and it is tied to WebKit on Apple devices. Edge at 5.36% is Chromium under Microsoft, and it is the largest of the browsers that sit below 6%.
Firefox at 2.57% is the Gecko browser from Mozilla, so it is the independent engine in this list rather than another Chromium build. Opera at 2.16% and Samsung Internet at 2.05% are both Chromium, one from Opera Software and one from Samsung's mobile ecosystem. Every remaining named browser is below 6%. The combined 97.52% shows how concentrated the month was, and 2.48% is everything else mixed together.
Quote 68.79% as the global benchmark only with the date, the publisher and the scope attached: all devices, worldwide, October 2026, observed web usage from StatCounter Global Stats. Drop any one of those and the figure stops being checkable.
Why Browser Share Estimates Disagree and Which Scope to Quote
Two reputable counters can put Chrome anywhere from about half of web usage to more than two thirds, and both can be right at once. Every browser share is a percentage of measured web usage, so the result depends on what was counted: the site sample, the device mix, the geography and the unit. It is never a census of installed browsers, and no single ranking covers every question.
Ahrefs reports Chrome at 49.78%, Safari at 18.98%, Edge at 3.41% and Firefox at 1.55%, based on visits across 118,671 websites. Ahrefs does not attach a month to this reading, so it cannot be compared directly with the October 2026 StatCounter figures. StatCounter's worldwide series for that month reports Chrome at 68.79%, Safari at 16.59%, Edge at 5.36% and Firefox at 2.57%. Placed side by side, the method shows up in the cells.
Ahrefs and StatCounter browser shares for four browsers
| Browser | Ahrefs share (visits, 118,671 websites, period not stated) | StatCounter share (all devices, worldwide, October 2026) |
|---|---|---|
| Google Chrome | 49.78% | 68.79% |
| Apple Safari | 18.98% | 16.59% |
| Microsoft Edge | 3.41% | 5.36% |
| Mozilla Firefox | 1.55% | 2.57% |
Chrome's two readings differ by about 19 percentage points. The gap comes from the site sample, the traffic mix, device weighting, geographic coverage, and whether the unit is visits or browser observations. Safari runs higher in the Ahrefs visit panel, while Edge and Firefox run lower there. Because the populations differ, the distance between the columns describes two different things being measured. It records no browser gaining or losing users between two months.
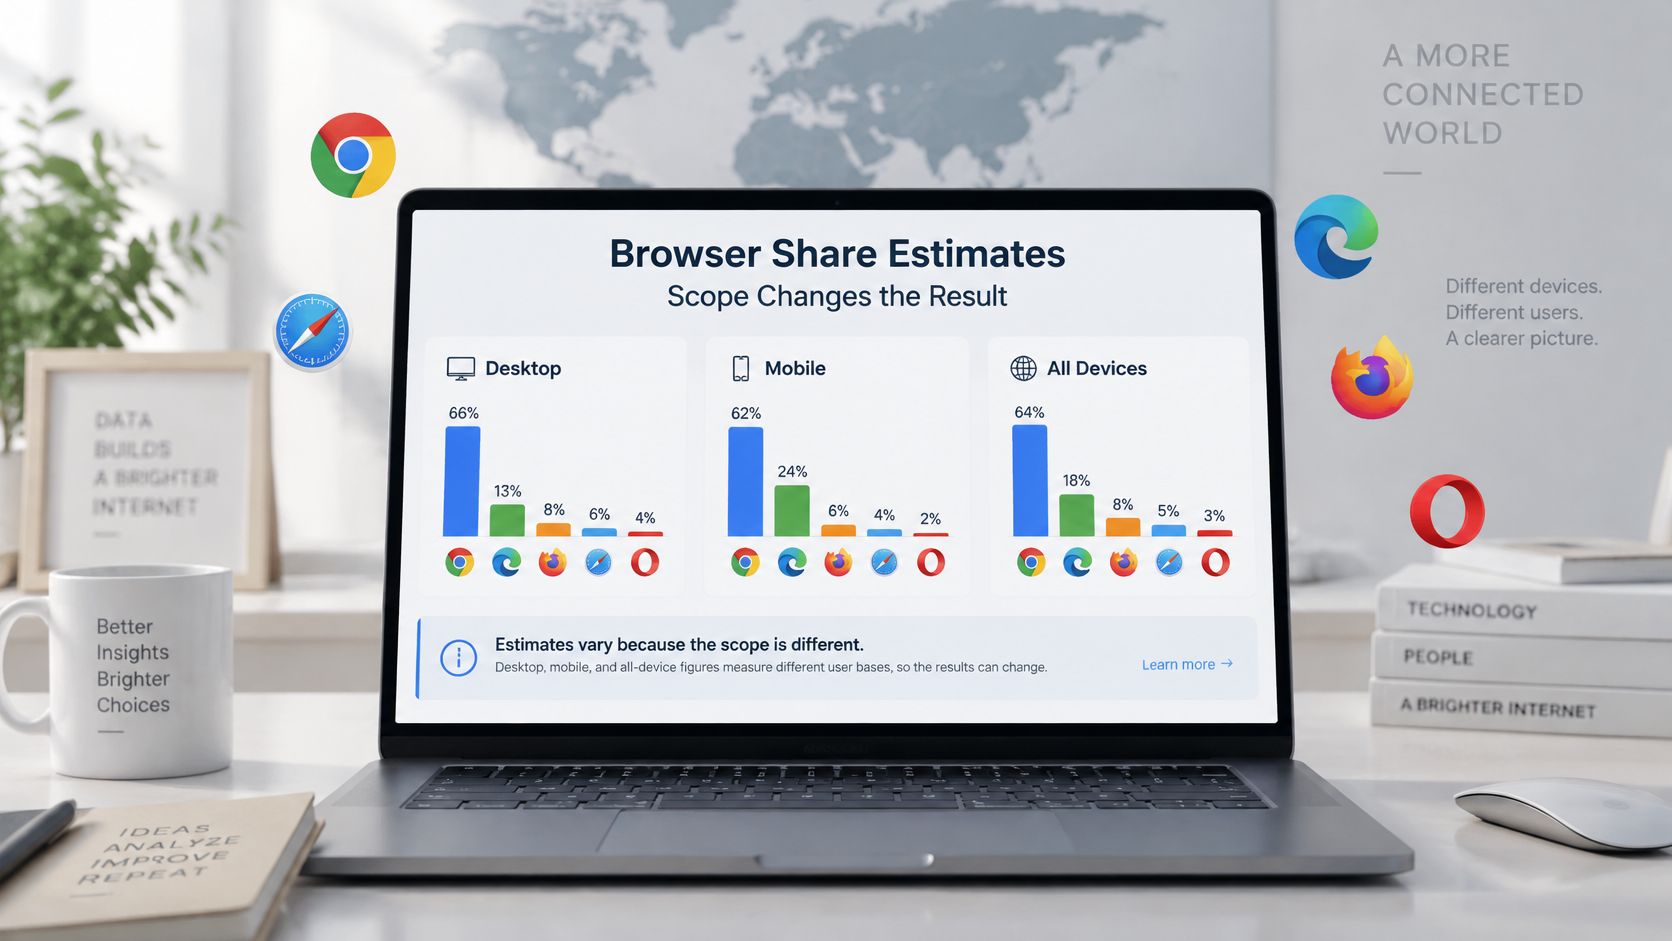
Even one publisher can print two worldwide figures
Scope still decides the number inside a single publisher. StatCounter's worldwide desktop-and-mobile series reported Chrome at 69.04% in October 2026, with Safari at 16.40%, Edge at 5.41%, Firefox at 2.61%, Opera at 2.18% and Samsung Internet at 2.06%. Its all-device reading for the same geography and month put Chrome at 68.79% and Safari at 16.59% instead. Two worldwide figures from one publisher in one month, separated only by which devices were counted. A citation has to reproduce the stated scope exactly, because "worldwide in October 2026" isn't precise enough.
A browser share can only be compared with another share that has the same population and unit, so panel data and web-analytics data never share one trend line.
All of the publishers in this set are web-measurement services, not statistical offices and not survey institutes. This set also has no country ranking, no regional ranking and no mobile-only ranking, so readers should use the source's own filters. Mobile share can't be derived by subtracting a desktop figure from a combined figure, because the series aren't built to be taken apart that way.
Version rows aren't family totals
In October 2026, across desktop and mobile worldwide, StatCounter's browser-version series put Chrome for Android at 40.15% of browser-version usage and Chrome for iPhone at 3.22%. Adding those two listed rows gives 43.37%. That sum isn't Chrome's overall family share, because the table splits platform builds from numbered versions such as Chrome 155.0. Version rows describe where a build is running. They answer a different question than the family ranking, and they shouldn't be added into it.
The rule for quoting one figure
The right share follows the question, not the size of the number. For a global benchmark, the StatCounter all-device figure applies, quoted with its month and geography. For a visit-weighted sample of websites, the Ahrefs panel applies, quoted with its 118,671-site base and its unstated period. For questions about builds and engines, the version table applies, quoted at the row level. The checks behind each choice are the same ones a guide on how to read a survey statistic lays out: match the population and unit to the question, keep one methodology across time, report desktop and mobile separately when the question needs it, and never drop a visit panel and a web-analytics series onto one line.
Desktop Share Versus Combined Share
Desktop browsing in October 2026 doesn't follow the combined ranking. StatCounter's desktop series covers desktop devices worldwide and excludes mobile and tablet browsing. Chrome represented 66.98% of that desktop usage, followed by Edge at 13.24%, Safari at 7.83%, Firefox at 5.72%, Opera at 2.65% and Brave at 1.01%.
The chart below sets the desktop bars against the all-device reading for the same month.
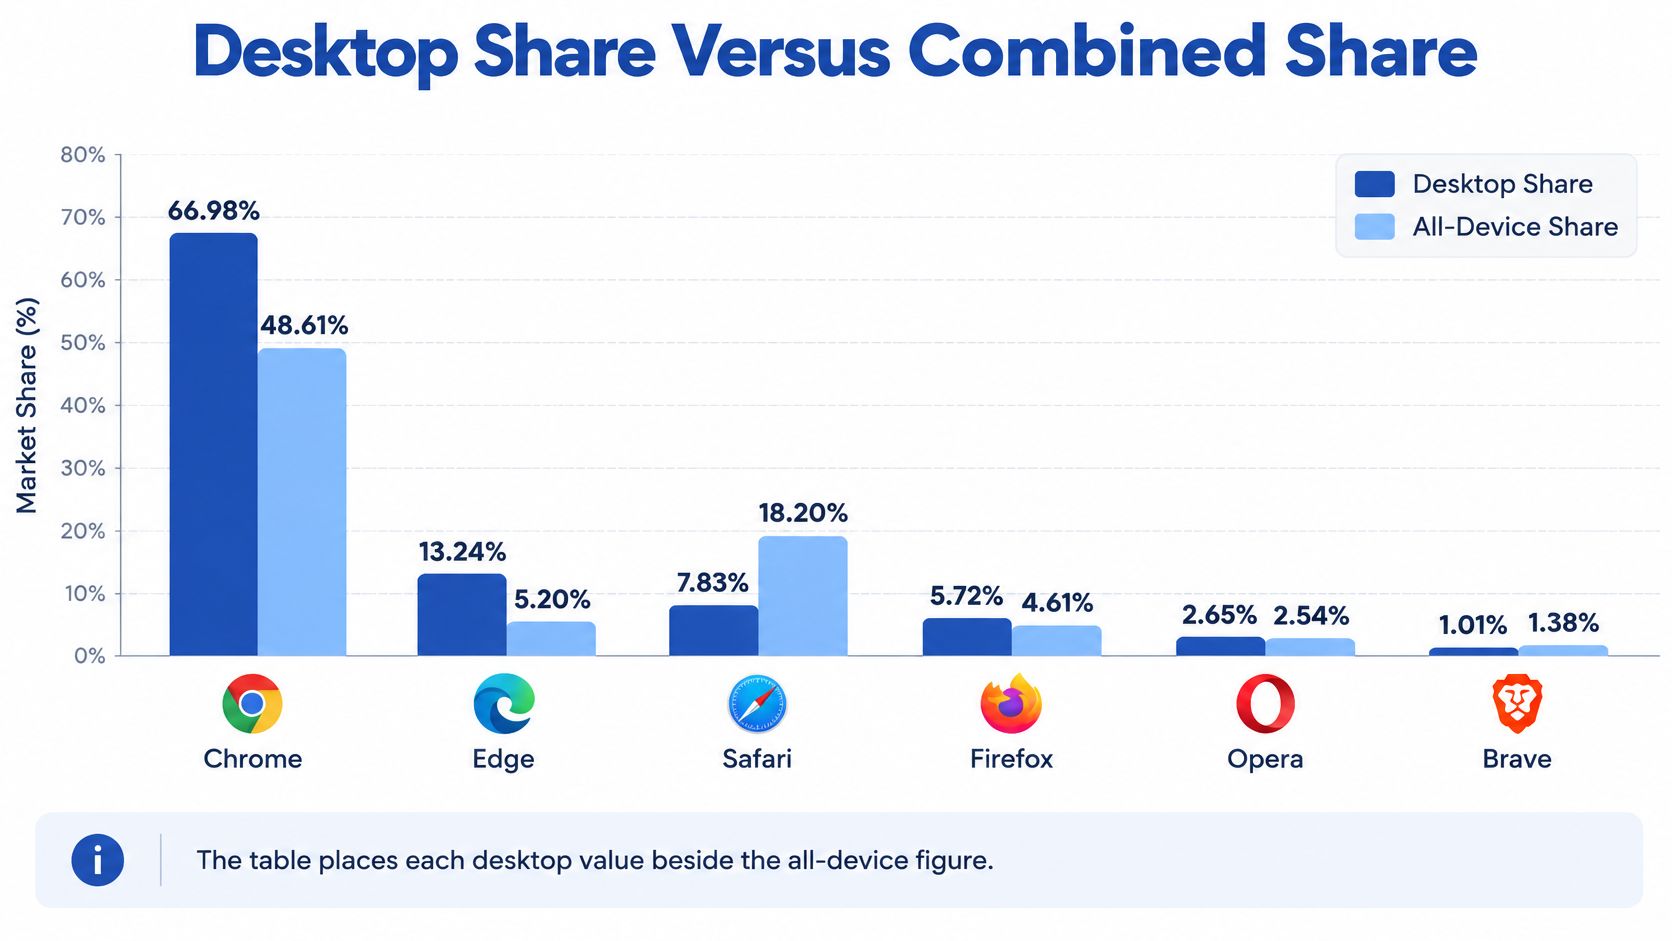
Desktop share compared with all-device share, October 2026
| Browser | Desktop share | All-device worldwide share |
|---|---|---|
| Google Chrome | 66.98% | 68.79% |
| Microsoft Edge | 13.24% | 5.36% |
| Apple Safari | 7.83% | 16.59% |
| Mozilla Firefox | 5.72% | 2.57% |
| Opera | 2.65% | 2.16% |
| Brave | 1.01% | Not published |
Where the points move
The arithmetic is ordinary subtraction, and it is worth doing in the open. Edge's desktop share of 13.24% minus its all-device share of 5.36% is 7.88 percentage points. Safari's all-device share of 16.59% minus its desktop share of 7.83% is 8.76 percentage points the other way. Chrome's 66.98% on desktop against 68.79% on all devices is a loss of 1.81 percentage points, a small move beside the other two. Firefox rises from 2.57% to 5.72% once the view is desktop only, a gain of 3.15 points. Opera moves from 2.16% to 2.65%. Brave's all-device share for this month isn't published in this set, so that cell stays blank rather than guessed.
The pattern is about weight, not about a browser "winning" a device. Safari's combined share is much larger than its desktop share, so mobile usage carries most of its weight. A desktop plan that borrows the combined Safari figure will overstate Safari on desks and understate Edge. Edge and Firefox are stronger once phones and tablets are left out. Companion reading on smartphone usage statistics is the right next check when a desktop share looks surprisingly small.
Name the category whenever a figure is quoted. "Desktop, worldwide, October 2026" and "all devices, worldwide, October 2026" are different measurements, even when the publisher and the month match. Rankings change when mobile usage is folded in, and a sentence that omits the device scope invites the wrong comparison.
Browser Share Trends From 2024 to 2026
These readings sit in one table so each period keeps its own source. They aren't one trend line.
Browser share readings from 2024 to October 2026
| Period | Source | Chrome | Safari |
|---|---|---|---|
| February 2024 | W3Counter | Not published | 14.9% |
| August 2024 | W3Counter | 68.2% | Not published |
| September 2024 | W3Counter | 68.6% | 15.2% |
| October 2024 | W3Counter | 68.7% | Not published |
| November 2024 | W3Counter | 67.89% | Not published |
| Full year 2024 | SOAX | 65.16% | Not published |
| October 2026 | StatCounter | 68.79% | 16.59% |
Which readings can sit together
The monthly cells come from W3Counter's traffic-based global web statistics. In February 2024, Safari accounted for 14.9% of global browser market share in W3Counter's February snapshot. In August 2024, Chrome held 68.2%, calculated by W3Counter from traffic to websites using its free web statistics service. In September 2024, W3Counter put Chrome at 68.6% and Safari at 15.2%. In October 2024, Chrome accounted for 68.7% in W3Counter's October statistics. In November 2024, Chrome led with 67.89% of recorded global browser observations in a W3Counter snapshot based on 12,240,523 observations.
For 2024 overall, Chrome's global browser market share was 65.16%, according to SOAX's analysis published in February 2025. The October 2026 endpoint, from StatCounter's all-device worldwide series, is Chrome at 68.79% and Safari at 16.59%.
Inside the W3Counter months cited here, Chrome sits close to 68% and Safari, where it is published, sits in the mid-teens. That is the only pattern these monthly readings support. The SOAX figure for the full year is lower than those monthly Chrome readings because it is a different measure and a different period. It isn't evidence that Chrome fell through 2024, and it shouldn't be averaged with the monthly cells.
Treat a small gap between two publishers as a method effect. Look for movement only inside one source, one method and one device scope.
This set holds no 2025 readings. The series therefore moves from November 2024 to October 2026 with a gap, and that missing year isn't filled in here. W3Counter and StatCounter use different methods, so the 2024 monthly cells and the October 2026 cells stay in separate comparisons. A blank Safari cell means that snapshot didn't publish Safari in the material used here. It doesn't mean Safari's share was zero.
Choose the Right Browser Share Figure for Your Question
Match the figure to the decision, then stop. One global ranking can't serve a desktop plan, a multi-year chart and an audience estimate at the same time.
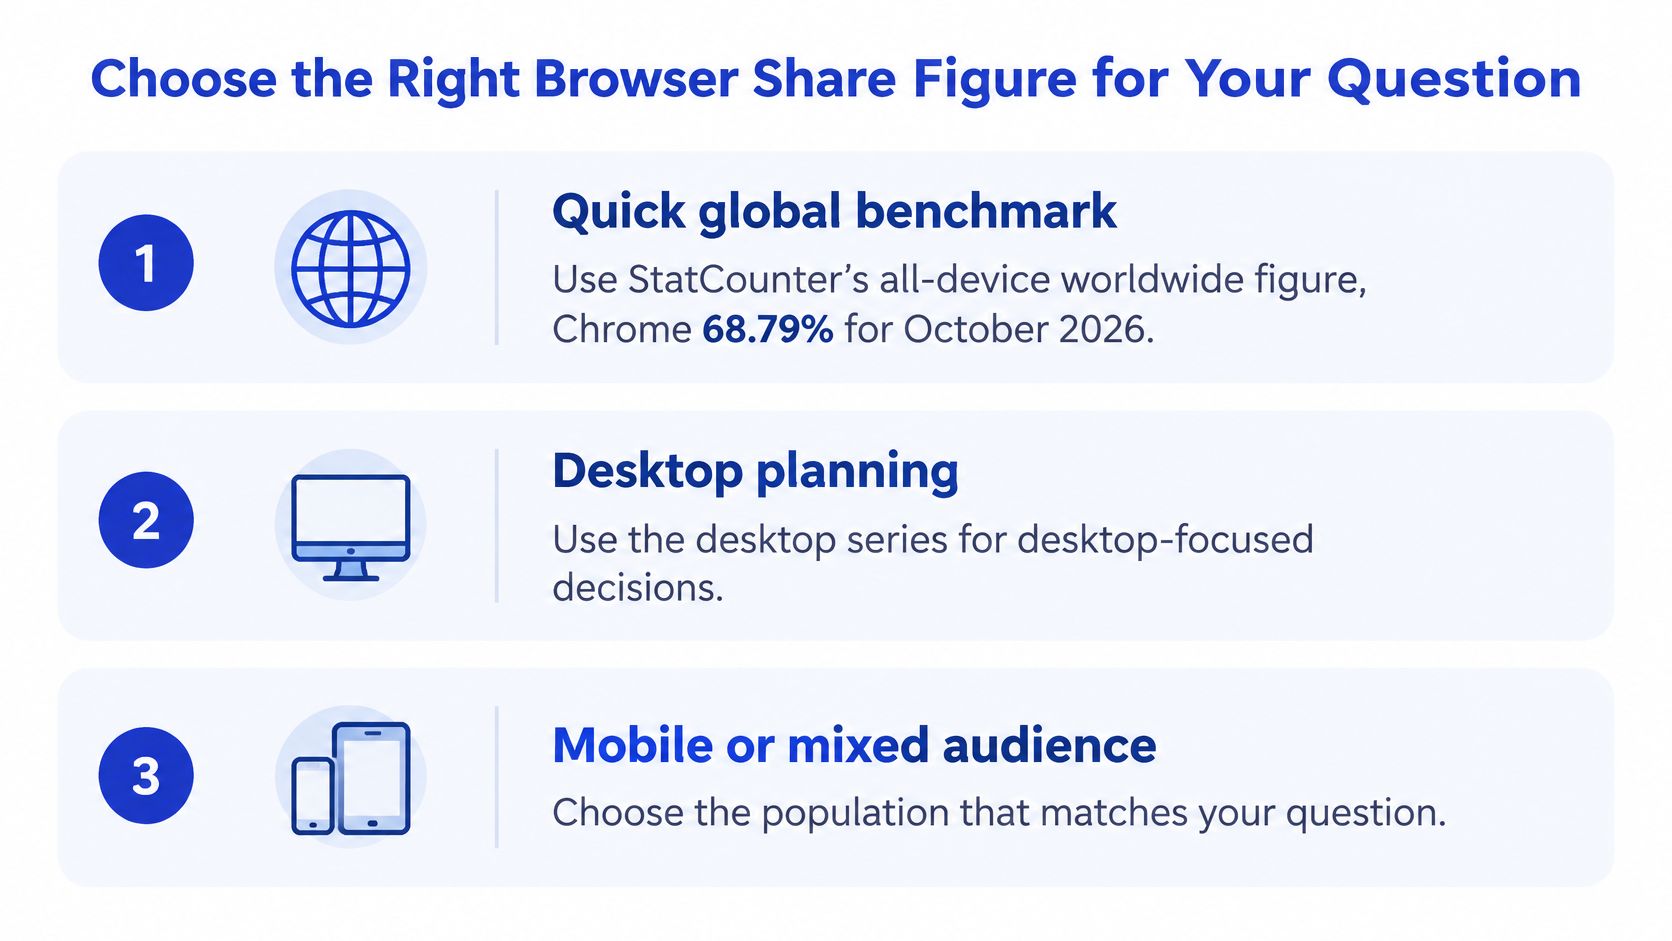
For a quick global benchmark, use StatCounter's all-device worldwide figure, Chrome at 68.79% for October 2026, and write the scope beside it. For desktop planning, use the desktop series, Chrome at 66.98% and Edge at 13.24%, because Edge's place changes once phones drop out. For a multi-year trend, stay inside one publisher's monthly series and name that publisher in the caption. For an audience-specific decision, use the site's own analytics. A worldwide mix is a poor stand-in for one publisher's visitors.
Five checks before a number is quoted
Statlyst collects its figures from primary sources, statistical offices, researchers and the organizations that ran the survey, with no aggregators. Browser share in this field comes from web-measurement providers rather than statistical offices, so the test is whether that provider states its method and its scope.
- Provider: Name the organization that published the reading.
- Year and month: Keep the period exact, and don't borrow a neighboring month.
- Population: Say all devices, desktop, or mobile. Don't leave it implied.
- Geography: Say worldwide, or name the country the filter used.
- Unit: Say visits or browser observations, and don't mix the two on one line.
Before publishing or planning, write the source, the scope and the date beside every number, and re-check each quote against the original release.
How to Use Browser Share to Set Test Priorities
Share is a way to order work. It isn't a substitute for how a page is built.
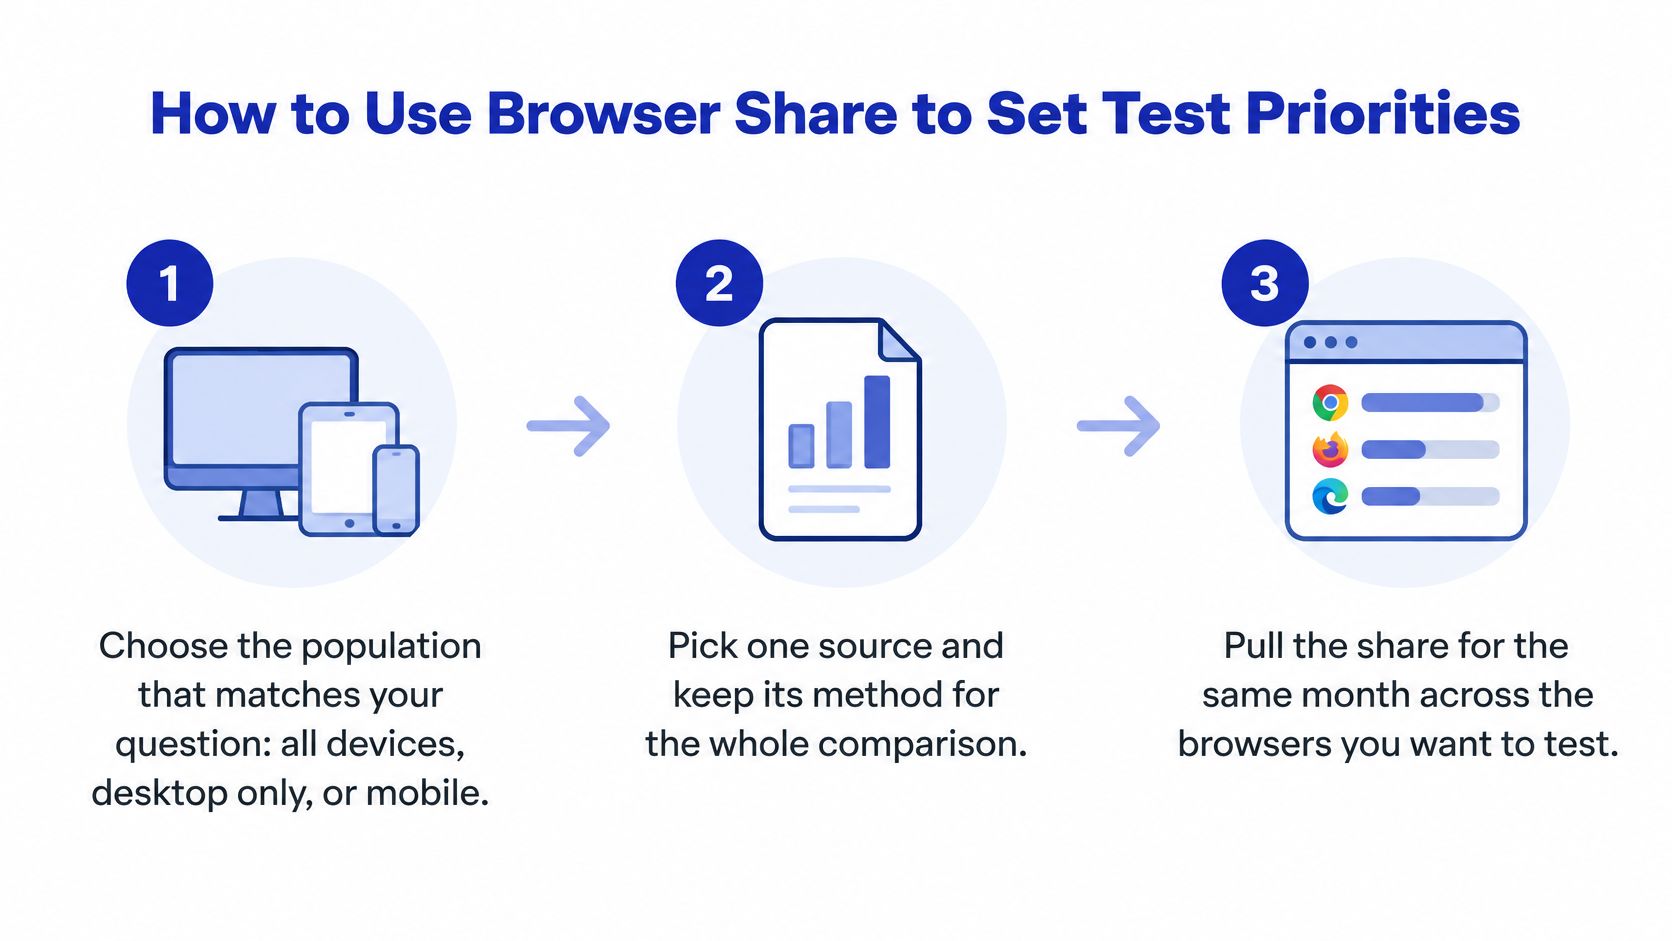
- Choose the population that matches the question, all devices, desktop only, or mobile, because a combined figure will mis-order a desktop matrix.
- Pick one source and keep its method for the whole comparison, because a visit panel and an observation series don't form a single ranking.
- Pull the share for the same month across at least three periods, so one unusual month doesn't set the budget.
- Rank the browsers and mark those above 10% as baseline coverage. On the October 2026 worldwide reading, that pair is Chrome and Safari.
- Assign tiers from technical divergence, not from the logo count. Chromium-based browsers get broad regression coverage, Safari and WebKit get explicit device and viewport checks, and Firefox stays in standards-conformance and accessibility checks.
- Replace the global mix with the site's own analytics, using a short list of website analytics tools, because visitors can cluster on a browser the worldwide table treats as small.
- Re-check the figures each quarter and record the source, the scope and the date beside each number, so a later edit can't detach the figure from its release.
Say a news site's traffic is mostly desktop Windows. Edge earns an earlier slot than it would on a phone-heavy shop, and Safari's checks move toward the Mac and iPhone cases the analytics show. The worldwide order is the fallback when analytics aren't available yet. It isn't the last word once they are.
Market-share percentages should guide test priority. They don't replace feature detection, standards-based implementation, or checks on real devices. A page that only passes in the largest browser still fails the readers who arrive in the second one.
Pull the October 2026 figure you need, all devices or desktop, write StatCounter, the device scope and the month next to it, and drop any quote that can't carry those three. Statlyst keeps citable technology figures with the original sentence, the publisher and the data year attached, so the next citation starts from the release rather than from a rounded headline.
Questions or corrections: editorial@statlyst.com